

From my experience with ChartAI, I found it excels at simplifying the creation of professional charts without requiring design expertise. The AI-driven suggestions help users quickly visualize data, making it especially useful for business analysts and educators who need fast, clear visualizations. However, the platform’s customization options, while sufficient for most users, may feel limited for advanced designers seeking granular control. Overall, if you want to save time on chart creation and produce clean, effective visuals with minimal effort, ChartAI is a solid choice.
ChartAI - AI-Powered Data Visualization and Chart Generation Tool
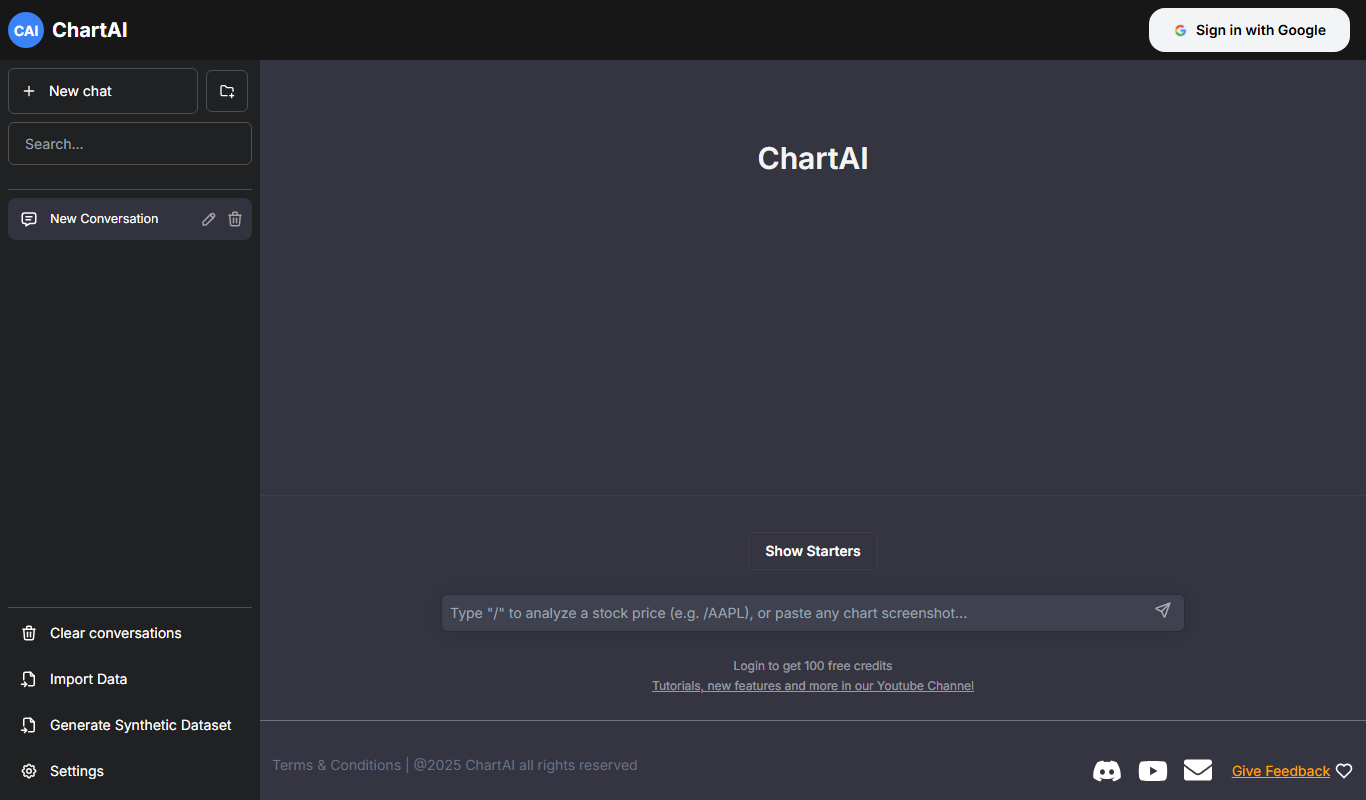
ChartAI is an AI-powered web tool that automatically generates professional charts from raw data, enabling users to visualize information quickly without design expertise.
- Best for
- Automated Chart Creation
- Key capability
- AI-Powered Chart Recommendations
Your actions

Do you recommend this tool?
What is ChartAI?
ChartAI is a web-based AI-powered tool designed to simplify and accelerate the process of creating data visualizations. By leveraging artificial intelligence, it transforms raw data into clear, professional charts without requiring manual design skills. This tool is ideal for business professionals, analysts, educators, and anyone needing quick, accurate visual representations of data.
Key features of ChartAI
ChartAI offers automated chart generation, multiple chart types, customization options, and export capabilities. Its AI engine interprets data context to recommend the most effective visualization, streamlining the workflow from data input to presentation-ready charts.
AI-Powered Chart Recommendations
Automatically suggests the best chart types based on data analysis.
Multiple Chart Types
Supports bar, line, pie, scatter, and other common chart formats.
Customization Tools
Allows users to modify colors, labels, legends, and other visual elements.
Easy Data Input
Supports data upload via CSV or manual entry for flexibility.
Export Options
Download charts as images or PDFs for use in reports and presentations.
Pros and cons of ChartAI
Pros
- Simplifies complex data visualization with AI assistance
- User-friendly interface requiring no design skills
- Supports multiple chart types and customization
- Quick chart generation saves time
- Free plan available for basic use
Cons
- Limited advanced analytics features
- Customization options may not satisfy expert designers
- Only available as a web platform
Key use cases for ChartAI
Automated Chart Creation
Generate professional charts automatically from raw data using AI, saving time and effort.
Business Reporting
Create clear and insightful visual reports for stakeholders without manual chart design.
Data Analysis Visualization
Visualize complex datasets quickly to identify trends and patterns with AI assistance.
Presentation Enhancements
Enhance presentations with visually appealing charts generated on demand.
Educational Use
Help students and educators visualize data concepts through easy-to-create charts.
How ChartAI works
- 1
Upload or Input Data
Users provide data by uploading files or entering data directly into the platform.
- 2
AI Analyzes Data
The AI engine processes the data to understand its structure and key insights.
- 3
Generate Chart Suggestions
ChartAI proposes suitable chart types and visualizations based on the data.
- 4
Customize and Edit
Users can adjust chart styles, colors, labels, and other elements to fit their needs.
- 5
Export or Share
Final charts can be downloaded in various formats or shared directly from the platform.
Who is using ChartAI
Business analysts
Marketing professionals
Educators and students
Small to medium businesses
Data enthusiasts
ChartAI pricing
Free
$0/month
Basic access with limited chart generation and export options.
Pro
$15/month
Unlimited chart generation, advanced customization, and priority support.
Plans and prices are as published by the vendor and can change. Check the official site before you buy. Open the pricing page (opens in a new tab)
Frequently asked questions about ChartAI
ChartAI supports bar, line, pie, scatter, and other common chart types.
Yes, users can adjust colors, labels, and other design elements to suit their needs.
Yes, ChartAI offers a free plan with basic features and limited usage.
Charts can be exported as image files or PDFs directly from the platform.
It depends on your specific needs and how you plan to use the tool. The official website and documentation are the best sources for the latest details.
Yes, it can help with that use case depending on how you configure it and what features are available. You’ll get the best results with clear inputs and a defined goal.
Some tools offer a free plan or trial with limited features. Availability can vary, so confirm on the official website.
Yes, it can help with that use case depending on how you configure it and what features are available. You’ll get the best results with clear inputs and a defined goal.
Sign in to review this tool.
Sign In to ReviewNo reviews yet
Be the first to share how this tool worked for you.
Ask about pricing, limits, or how it compares — or answer someone else.
Sign In to AskNo questions yet
Have a question about using or paying for this tool? Be the first to ask.
Featured on TiorAI



Alternative Tools
Explore similar AI tools that might fit your needs
Free
Datawrapper
Datawrapper is a web-based tool that allows users to create interactive charts, maps, and tables from data without coding, ideal for journalists, marketers, and educators.

Free
Infogram
Infogram is a web-based platform that allows users to create interactive infographics, charts, and reports using customizable templates and live data integration without coding skills.
More Data Visualization tools
Other tools in the same category, for when this one is not quite the fit.

Free Trial
Mixflow.AI
Mixflow.AI is an AI-powered analytics platform that transforms data into actionable insights through customizable dashboards, real-time processing, and predictive analytics.

Free
AI graph maker
AI Graph Maker is a free web-based tool that uses AI to help users quickly create and customize various types of graphs and charts from their data without needing advanced skills.

Free
Hadana.io
Hadana.io is a decentralized blockchain analytics platform that enables users to explore, visualize, and analyze blockchain data interactively with real-time updates and developer APIs.

Free Trial
Stat Pick AI
Stat Pick AI is an AI-based sports analytics platform providing predictive performance insights, real-time data, and customizable dashboards for multiple sports to assist fantasy players, bettors, coaches, and journalists.

Freemium
Graphy for Data Storytelling
Graphy is a web-based platform designed for creating interactive data stories by combining data visualization with narrative elements, enabling users to communicate insights effectively.

Free
Sonify
Sonify is a web platform that converts data into interactive sound and visual experiences, enabling users to explore data through audio sonification without coding skills.

Free
Vizzy
Vizzy is a free web-based AI tool that transforms CSV data into interactive charts and graphs, enabling easy data exploration without coding.

Free Trial
Excel Dashboard Ai
Excel Dashboard AI is a tool that uses artificial intelligence to automate the creation of Excel dashboards and reports, enabling users to quickly generate professional data visualizations without advanced Excel skills.