

From my experience with Rerun, I found it excels at providing developers with a powerful and intuitive platform for real-time 3D visualization of complex data streams. Its ability to handle live data and recorded playback makes debugging and analysis much more efficient, especially in robotics and simulation contexts. The developer-friendly SDKs and cross-platform support further enhance its usability. However, the tool is quite technical and may have a steeper learning curve for non-developers, and pricing might be a consideration for smaller teams. Overall, if you need advanced, interactive visualization for real-time or recorded data, Rerun delivers robust and practical solutions.
Rerun Real-Time 3D Visualization Platform for Developers and Engineers
Rerun is a developer-focused platform that enables real-time 3D visualization and playback of streaming data, ideal for robotics, simulations, and complex data analysis.
- Best for
- Robotics Data Visualization
- Key capability
- Real-Time 3D Visualization
Your actions
Save Rerun, follow its updates and vote on it — everything stays in your account.
Sign in or create a free account
What is Rerun?
Rerun is a developer-focused platform designed to provide real-time 3D visualization and playback of streaming data. It enables engineers and developers to visualize complex data from robotics, simulations, and other real-time systems in an interactive and intuitive way. The platform supports live data streaming, recording, and playback, helping users debug, analyze, and understand their systems more effectively.
Key features of Rerun
Rerun offers real-time 3D visualization, interactive playback of recorded data, support for multiple data types including point clouds and meshes, and seamless integration with developer tools and workflows. It is optimized for performance and usability, providing a powerful interface for inspecting complex datasets.
Real-Time 3D Visualization
Visualize streaming data live with smooth, interactive 3D graphics.
Playback and Recording
Record data streams and replay them frame-by-frame for detailed inspection.
Multi-Format Support
Supports point clouds, meshes, images, and other complex data types.
Developer-Friendly SDKs
Easy integration with popular programming languages and frameworks.
Cross-Platform Access
Access visualizations via web and desktop applications.
Pros and cons of Rerun
Pros
- Intuitive real-time 3D visualization tailored for developers
- Supports a wide range of complex data types
- Offers both live streaming and recorded playback
- Developer-friendly SDKs with good documentation
- Cross-platform support including web and desktop
Cons
- Pricing may be high for small teams or hobbyists
- Limited language support beyond English
- Primarily focused on technical users, less suited for non-developers
Key use cases for Rerun
Robotics Data Visualization
Visualize and analyze real-time sensor data streams from robots to debug and optimize performance.
Simulation Playback
Replay and inspect 3D simulations frame-by-frame for detailed analysis and troubleshooting.
Real-Time Monitoring
Monitor live data streams from IoT devices or autonomous systems with interactive 3D visualizations.
Developer Debugging Tool
Integrate with development workflows to visualize complex data structures and events in real time.
Data Exploration
Explore large datasets visually to identify patterns, anomalies, and insights quickly.
How Rerun works
- 1
Install SDK
Add Rerun’s SDK to your project to start sending data streams to the platform.
- 2
Stream or Record Data
Send real-time data from your application or record sessions for later playback.
- 3
Visualize in 3D
Use Rerun’s interface to view, interact with, and analyze your data in real time or from recordings.
- 4
Debug and Analyze
Leverage visualization tools to identify issues, optimize performance, and gain insights.
Who is using Rerun
Robotics engineers
Simulation developers
IoT system developers
Data scientists working with spatial data
Software developers needing advanced visualization
Rerun pricing
Free
$0/month
Basic access with limited data retention and features suitable for individual developers.
Pro
$49/month
Advanced features including extended data retention, priority support, and collaboration tools.
Plans and prices are as published by the vendor and can change. Check the official site before you buy. Open the pricing page (opens in a new tab)
Frequently asked questions about Rerun
Rerun supports various data types including 3D point clouds, meshes, images, and time-series data.
Yes, Rerun is designed with robotics and real-time systems in mind, making it ideal for visualizing sensor data and simulations.
Rerun offers a desktop application that can be used offline for playback and visualization of recorded data.
Yes, Rerun provides SDKs for languages like Python and Rust to facilitate easy integration.
This tool is designed to help users accomplish its core tasks more efficiently. It is typically used by individuals or teams looking to improve productivity and workflow.
Data handling and security practices vary by provider. Review the official privacy policy to understand how your data is stored and used.
Integration support depends on the tool and its available connectors or API. Check the official documentation or integrations page to confirm what is supported.
Some tools offer a free plan or trial with limited features. Availability can vary, so confirm on the official website.
Sign in to review this tool.
Sign In to ReviewNo reviews yet
Be the first to share how this tool worked for you.
Ask about pricing, limits, or how it compares — or answer someone else.
Sign In to AskNo questions yet
Have a question about using or paying for this tool? Be the first to ask.
Featured on TiorAI



Alternative Tools
Explore similar AI tools that might fit your needs

Free
Plotly
Plotly is a data visualization platform that enables users to create interactive charts and dashboards using Python, R, and JavaScript, suitable for data analysis, business intelligence, and web app development.
Free
Kepler.gl
Kepler.gl is an open-source, web-based geospatial data visualization tool developed by Uber that enables users to create interactive maps from large datasets without coding.
More 3D Visualization tools
Other tools in the same category, for when this one is not quite the fit.

Free Trial
Quick Home Dreamviz
Quick Home Dreamviz is an AI-driven web platform that transforms property plans and photos into realistic 3D visualizations and virtual tours, helping real estate professionals and homeowners showcase and plan properties effectively.

Freemium
Imaginary Interiors
Imaginary Interiors is a web-based virtual room design tool that helps users create 3D interior layouts to visualize furniture and decor before making changes or purchases.

Freemium
CommonAR
CommonAR is a cloud-based AR platform that allows users to create, publish, and share interactive 3D augmented reality experiences accessible via web browsers without requiring app downloads.
Freemium
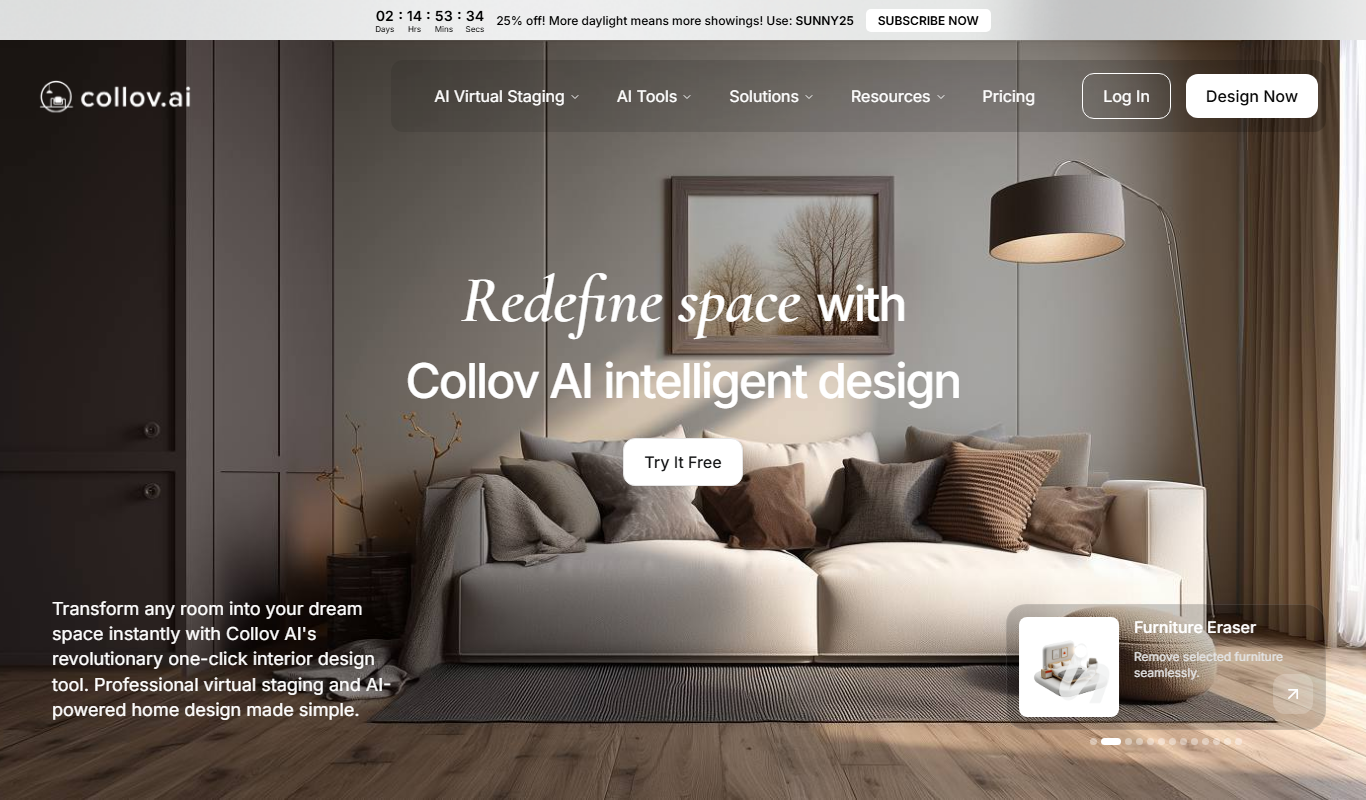
Collov AI
Collov AI is an AI-powered web-based interior design tool that generates photorealistic 3D room visualizations and design options to help users plan and customize interior spaces easily.

Enterprise
Immersive Fox
Immersive Fox is a VR platform that enables creation and sharing of interactive 3D environments accessible on VR devices and web browsers.

Free
Live3D
Live3D is a cloud-based platform that enables users to upload, customize, and embed interactive 3D models on websites and mobile devices without coding, featuring AR support and analytics.