

From my experience with Plotly, I found it excels at delivering highly interactive and customizable data visualizations that cater well to developers and data professionals comfortable with coding. Its multi-language support and the Dash framework make it a versatile choice for building not just charts but full analytical web applications. However, beginners without programming skills may face a learning curve, and some advanced features require a paid subscription. Overall, if you need a powerful platform to create dynamic, shareable data visualizations and dashboards, Plotly offers a robust and scalable solution.
Plotly Data Visualization Platform for Interactive Graphs and Analytics
Plotly is a data visualization platform that enables users to create interactive charts and dashboards using Python, R, and JavaScript, suitable for data analysis, business intelligence, and web app development.
Your actions
Save Plotly, follow its updates and vote on it — everything stays in your account.
Sign in or create a free account
What is Plotly?
Plotly is a comprehensive data visualization platform that enables users to create interactive, publication-quality graphs and dashboards. It supports multiple programming languages including Python, R, and JavaScript, and offers tools for building complex visual analytics applications. Plotly is widely used by data scientists, analysts, and developers to transform raw data into insightful visual stories.
Key features of Plotly
Plotly provides a rich set of features including an open-source graphing library, Dash framework for building analytical web applications, cloud-hosted collaboration tools, and integration with popular data science environments. Its interactive charts support zooming, panning, and real-time updates, making data exploration intuitive and effective.
Interactive Graphs
Supports a wide variety of chart types with interactive capabilities like zoom, hover, and click events.
Dash Framework
A Python framework for building analytical web applications with custom user interfaces.
Multi-language Support
Libraries available for Python, R, MATLAB, and JavaScript to cater to diverse developer needs.
Cloud Collaboration
Host, share, and collaborate on visualizations in the Plotly Cloud environment.
Extensive Customization
Highly customizable charts with control over layout, styling, and interactivity.
Pros and cons of Plotly
Pros
- Highly interactive and customizable visualizations
- Supports multiple programming languages
- Strong community and extensive documentation
- Dash framework enables full web app development
- Cloud platform for easy sharing and collaboration
Cons
- Steeper learning curve for beginners without coding experience
- Advanced features require paid subscription
- Limited offline capabilities without setup
Sign in to review this tool.
Sign In to ReviewNo reviews yet
Be the first to share how this tool worked for you.
Ask about pricing, limits, or how it compares — or answer someone else.
Sign In to AskNo questions yet
Have a question about using or paying for this tool? Be the first to ask.
Featured on TiorAI



More AI Analytics Assistant tools
Other tools in the same category, for when this one is not quite the fit.

Free
Litmaps
Litmaps is a web-based tool that helps researchers discover and visualize academic literature through interactive citation networks, enabling efficient literature reviews and research trend analysis.
Custom Pricing
Anodot
Anodot, now a Glassbox company, is an AI-driven anomaly detection platform that monitors business and operational data and provides alerts and root cause analysis.

Freemium
Equidam
Equidam is an online platform that automates startup and SME valuations by combining financial data and market benchmarks to generate investor-ready reports and equity distribution models.

Custom Pricing
WebFX
WebFX is a full-service digital marketing agency offering SEO, PPC, content marketing, web design, and analytics services to help businesses grow online.

Custom Pricing
SafeGraph
SafeGraph is a data platform for POI, building footprint and address data.

Custom Pricing
Placer.ai
Placer.ai is a location analytics platform that provides detailed foot traffic and consumer behavior insights using anonymized mobile device data, helping businesses optimize retail site selection, real estate analysis, and marketing strategies.
Free Trial
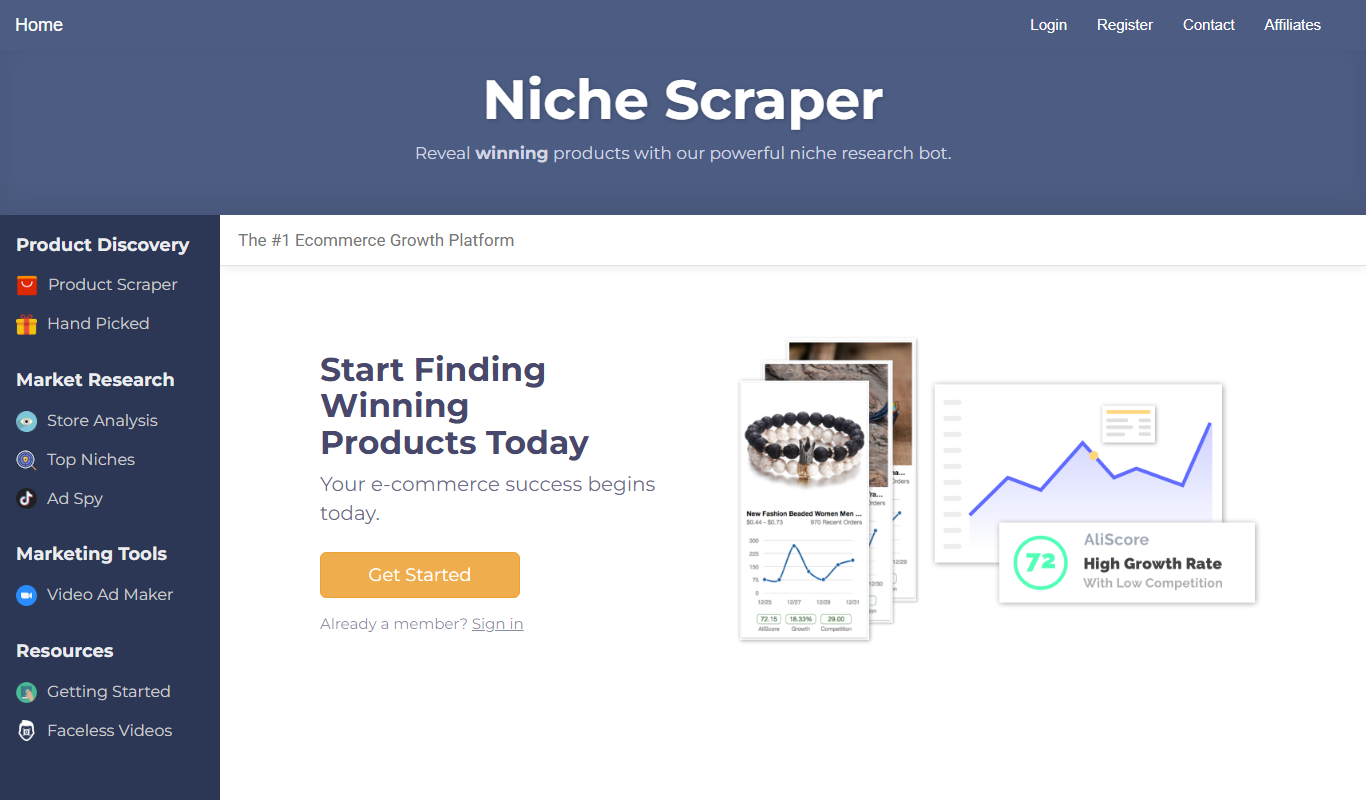
Niche Scraper
Niche Scraper is a web-based tool that helps dropshipping entrepreneurs find trending products and analyze competitor Shopify stores to build profitable ecommerce businesses.
Custom Pricing
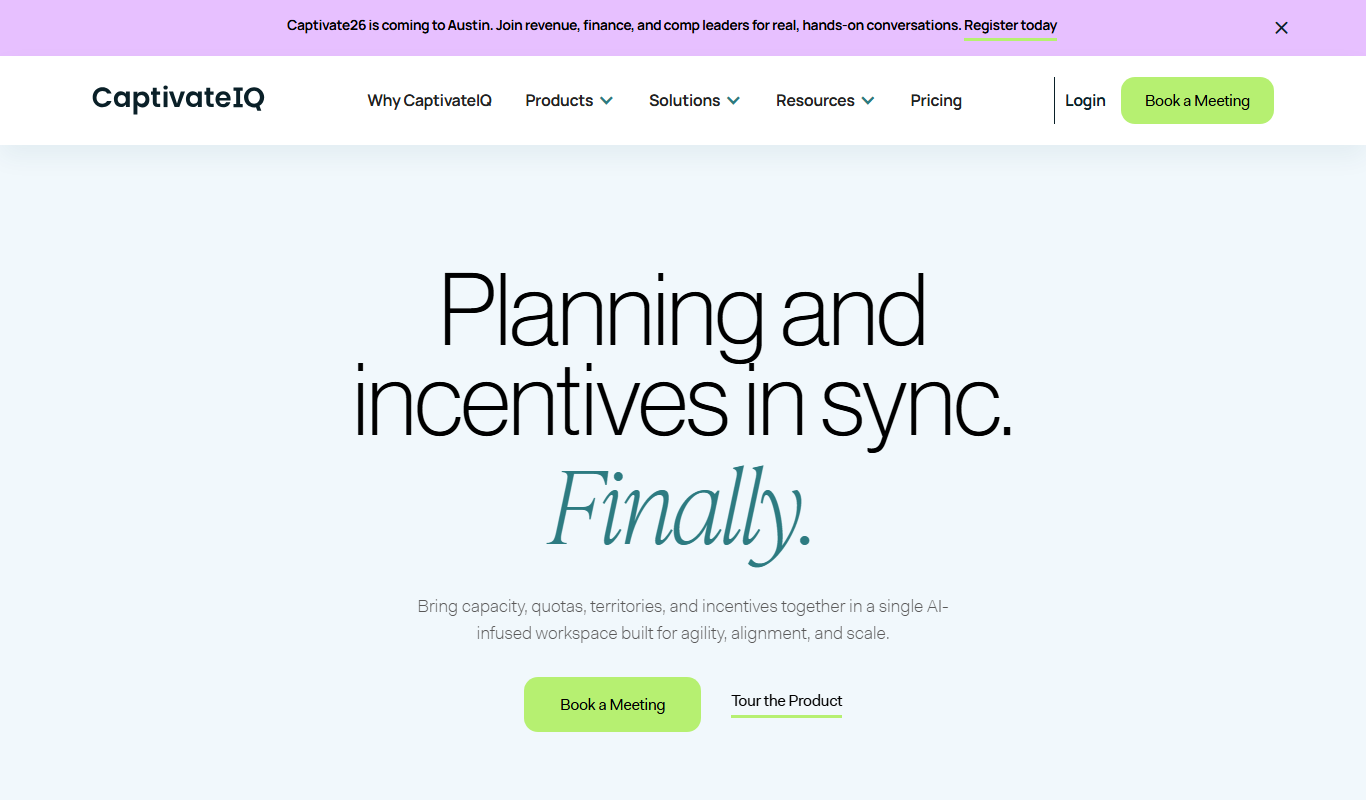
CaptivateIQ
CaptivateIQ is a cloud-based sales commission software that automates incentive compensation calculations, integrates with CRM and ERP systems, and provides real-time dashboards to improve sales performance management.