

From my experience with VMind, I found it excels at providing a modular and high-performance foundation for building interactive data visualizations, especially suited for web developers comfortable with JavaScript. The library’s open-source nature and flexible components make it a practical choice for rapid prototyping and integration into complex dashboards. However, the primary documentation being in Chinese can pose a challenge for non-Chinese speakers, and the community is smaller compared to more established global libraries. Overall, if you are looking for a lightweight, intelligent visualization component library with strong performance, VMind is a solid option.
VMind Visual Component Library for Intelligent Data Visualization in China
VMind is an open-source JavaScript visual component library by VisActor designed for creating intelligent, interactive data visualizations on the web.
- Best for
- Interactive Data Dashboards
- Key capability
- Modular Component Design

Do you recommend this tool?
What is 智能可视化基础组件库—VMind?
VMind is an intelligent visual component library developed by VisActor, designed to provide foundational building blocks for creating sophisticated data visualizations on the web. It offers a collection of reusable, customizable components that enable developers to build interactive charts and visual interfaces efficiently.
Key features of 智能可视化基础组件库—VMind
VMind features a modular architecture with a rich set of visualization components, supports high-performance rendering, and offers easy integration with modern JavaScript frameworks. It emphasizes flexibility, extensibility, and intelligent design to facilitate complex data visualization tasks.
Modular Component Design
Provides a wide range of reusable and customizable visualization components.
High Performance Rendering
Optimized for smooth rendering of complex and large datasets.
Flexible Data Binding
Supports various data formats and dynamic data updates.
Interactive Capabilities
Built-in support for user interactions like zoom, pan, and tooltips.
Easy Integration
Compatible with popular JavaScript frameworks and build tools.
Pros and cons of 智能可视化基础组件库—VMind
Pros
- Open-source and free to use
- Modular and customizable components
- High performance with large data
- Supports interactive visualizations
- Good integration with modern frameworks
Cons
- Documentation primarily in Chinese
- Limited global community compared to larger libraries
Key use cases for 智能可视化基础组件库—VMind
Interactive Data Dashboards
Build dynamic and interactive dashboards for business intelligence and analytics.
Custom Visualization Components
Develop tailored visualization components to fit specific data representation needs.
Web Application Integration
Integrate advanced visualization components seamlessly into web applications.
Rapid Prototyping
Quickly prototype data visualization concepts using pre-built components.
How 智能可视化基础组件库—VMind works
- 1
Install VMind Library
Add VMind to your project via npm or CDN to access the component library.
- 2
Import Components
Import required visualization components into your web application.
- 3
Configure Data and Styles
Bind your data sources and customize component styles and behaviors.
- 4
Render and Interact
Render visualizations on the web and enable user interactions.
Who is using 智能可视化基础组件库—VMind
Web developers
Data visualization engineers
Business intelligence teams
UI/UX designers
Software development companies
智能可视化基础组件库—VMind pricing
Free
$0
Open-source and free to use for all projects.
Plans and prices are as published by the vendor and can change. Check the official site before you buy. Open the pricing page (opens in a new tab)
Frequently asked questions about 智能可视化基础组件库—VMind
Yes, VMind is an open-source library available for free.
VMind is primarily a JavaScript/TypeScript library for web development.
Yes, VMind components can be integrated with popular frameworks like React and Vue.
Yes, VMind is optimized for high-performance rendering of large datasets.
This tool is designed to help users accomplish its core tasks more efficiently. It is typically used by individuals or teams looking to improve productivity and workflow.
Some tools offer a free plan or trial with limited features. Availability can vary, so confirm on the official website.
Data handling and security practices vary by provider. Review the official privacy policy to understand how your data is stored and used.
Integration support depends on the tool and its available connectors or API. Check the official documentation or integrations page to confirm what is supported.
Sign in to review this tool.
Sign In to ReviewNo reviews yet
Be the first to share how this tool worked for you.
Ask about pricing, limits, or how it compares — or answer someone else.
Sign In to AskNo questions yet
Have a question about using or paying for this tool? Be the first to ask.
Featured on TiorAI



Alternative Tools
Explore similar AI tools that might fit your needs
Free
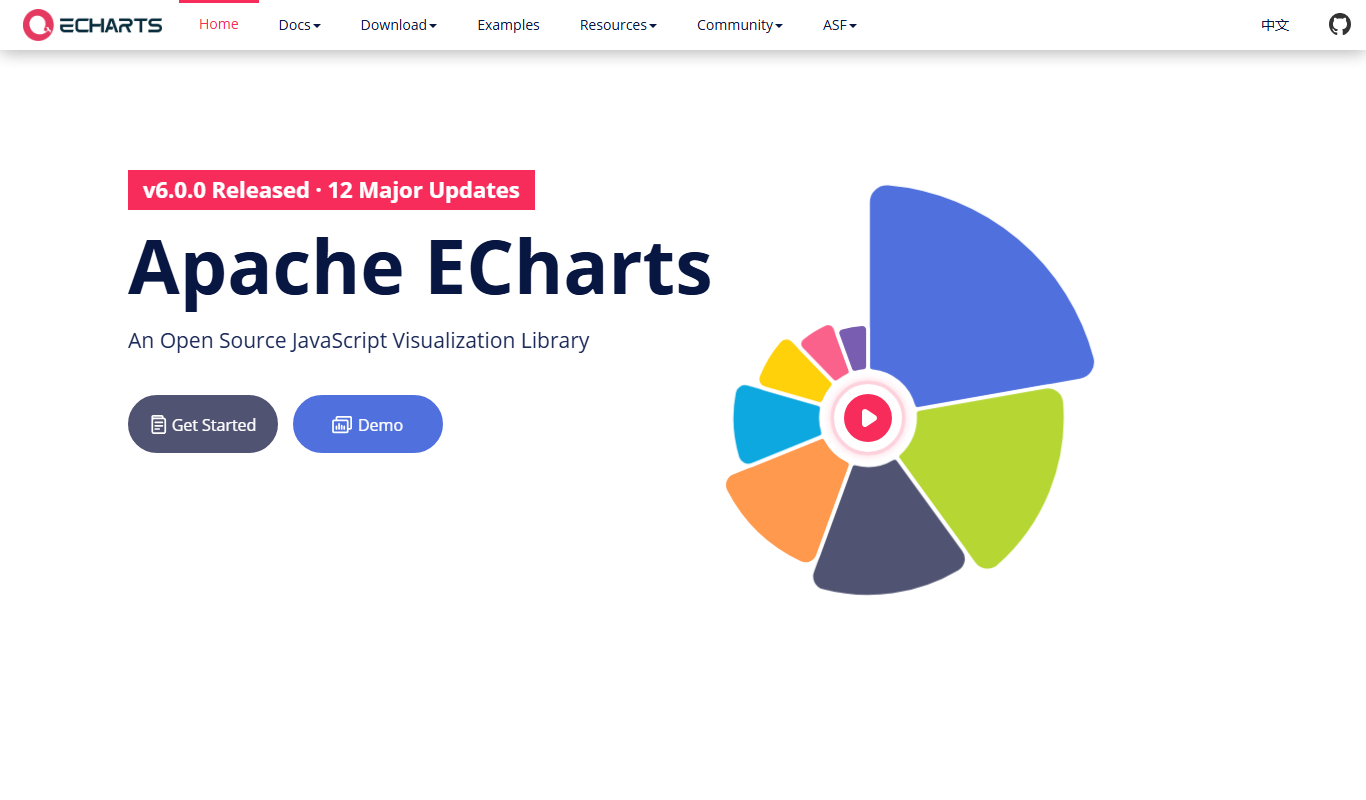
ECharts
ECharts is an open-source JavaScript library by Apache for creating interactive, customizable charts and data visualizations on web and mobile platforms.

Free
D3.js
D3.js is an open-source JavaScript library that enables developers to create dynamic, interactive data visualizations on the web using SVG, HTML, and CSS.
Free
Chart.js
Chart.js is an open-source JavaScript library that enables developers to create responsive, animated charts using HTML5 Canvas, supporting multiple chart types like line, bar, pie, and radar for web data visualization.
More Data Visualization tools
Other tools in the same category, for when this one is not quite the fit.

Free Trial
Mixflow.AI
Mixflow.AI is an AI-powered analytics platform that transforms data into actionable insights through customizable dashboards, real-time processing, and predictive analytics.

Free
AI graph maker
AI Graph Maker is a free web-based tool that uses AI to help users quickly create and customize various types of graphs and charts from their data without needing advanced skills.
Free
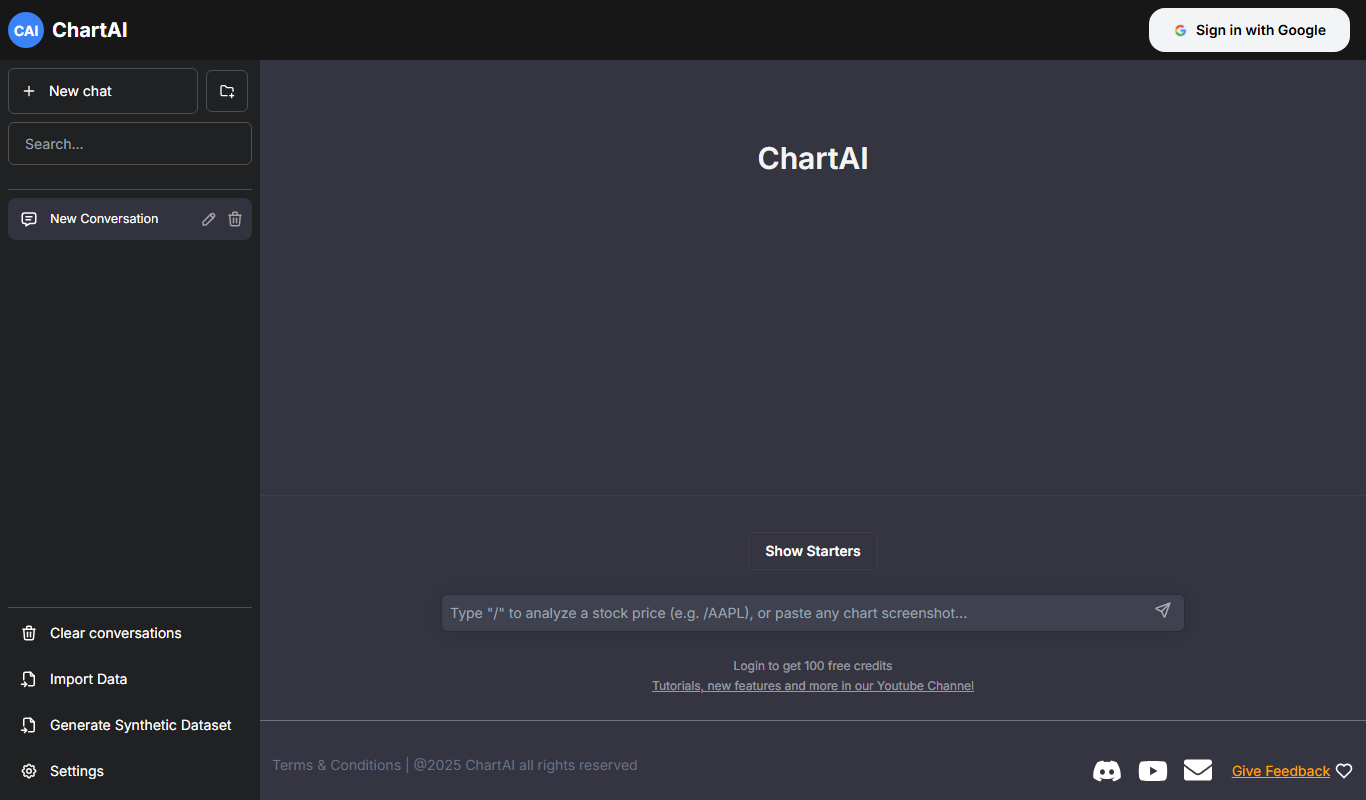
ChartAI
ChartAI is an AI-powered web tool that automatically generates professional charts from raw data, enabling users to visualize information quickly without design expertise.

Free
Hadana.io
Hadana.io is a decentralized blockchain analytics platform that enables users to explore, visualize, and analyze blockchain data interactively with real-time updates and developer APIs.

Free Trial
Stat Pick AI
Stat Pick AI is an AI-based sports analytics platform providing predictive performance insights, real-time data, and customizable dashboards for multiple sports to assist fantasy players, bettors, coaches, and journalists.

Freemium
Graphy for Data Storytelling
Graphy is a web-based platform designed for creating interactive data stories by combining data visualization with narrative elements, enabling users to communicate insights effectively.

Free
Sonify
Sonify is a web platform that converts data into interactive sound and visual experiences, enabling users to explore data through audio sonification without coding skills.

Free
Vizzy
Vizzy is a free web-based AI tool that transforms CSV data into interactive charts and graphs, enabling easy data exploration without coding.