

From my experience with Vizzy, I found it excels at quickly turning raw CSV data into interactive visualizations without requiring any coding skills. The AI-driven chart suggestions simplify the process of choosing the right visualization, making it especially useful for business professionals and students who need fast insights. However, the tool currently supports only CSV uploads and lacks advanced data transformation features, which might limit more complex analysis. Overall, if you want a straightforward, free solution for basic interactive data visualization, Vizzy delivers solid results with minimal effort.
Vizzy AI Data Visualization Tool for Interactive Charts and Graphs
Vizzy is a free web-based AI tool that transforms CSV data into interactive charts and graphs, enabling easy data exploration without coding.
- Best for
- Interactive Data Exploration
- Key capability
- AI-Powered Chart Suggestions


Do you recommend this tool?
What is Vizzy?
Vizzy is a web-based AI-powered data visualization tool designed to help users transform raw data into interactive charts and graphs effortlessly. It enables users to upload datasets and automatically generates insightful visualizations, making data analysis accessible even for those without technical expertise.
Key features of Vizzy
Vizzy offers AI-driven chart generation, interactive visualizations, and an intuitive web interface that simplifies the process of exploring and presenting data.
AI-Powered Chart Suggestions
Automatically recommends the most suitable chart types based on the dataset.
Interactive Visualizations
Enables users to explore data dynamically through interactive charts.
User-Friendly Interface
No coding required; designed for ease of use by non-technical users.
Data Upload Support
Supports common data formats like CSV for easy data import.
Pros and cons of Vizzy
Pros
- Easy to use with no coding required
- AI suggests optimal chart types automatically
- Interactive and customizable visualizations
- Free to use without hidden costs
Cons
- Limited to CSV data uploads
- No advanced data transformation features
- No mobile app or offline access
Key use cases for Vizzy
Interactive Data Exploration
Users can upload datasets and explore them through AI-generated interactive charts and graphs, making data insights more accessible.
Data Presentation
Create visually appealing and easy-to-understand visualizations for reports, presentations, or dashboards without needing coding skills.
Quick Data Analysis
Leverage AI to automatically suggest the best visualization types for your data, speeding up the analysis process.
How Vizzy works
- 1
Upload Data
Users upload their datasets in common formats such as CSV.
- 2
AI Visualization Generation
The AI analyzes the data and suggests appropriate chart types and visualizations.
- 3
Interact and Customize
Users can interact with the visualizations and customize them to fit their needs.
- 4
Export and Share
Visualizations can be exported or shared for presentations or reports.
Who is using Vizzy
Data analysts seeking quick visualization
Business professionals preparing reports
Students learning data visualization
Small businesses without dedicated data teams
Vizzy pricing
Free
$0
Access to all core features with no cost.
Plans and prices are as published by the vendor and can change. Check the official site before you buy. Open the pricing page (opens in a new tab)
Frequently asked questions about Vizzy
Vizzy currently supports CSV file uploads for data visualization.
No, Vizzy is designed with a user-friendly interface that requires no coding skills.
Yes, visualizations can be exported for use in reports or presentations.
Data handling and security practices vary by provider. Review the official privacy policy to understand how your data is stored and used.
Some tools offer a free plan or trial with limited features. Availability can vary, so confirm on the official website.
Yes, it can help with that use case depending on how you configure it and what features are available. You’ll get the best results with clear inputs and a defined goal.
Sign in to review this tool.
Sign In to ReviewNo reviews yet
Be the first to share how this tool worked for you.
Ask about pricing, limits, or how it compares — or answer someone else.
Sign In to AskNo questions yet
Have a question about using or paying for this tool? Be the first to ask.
Featured on TiorAI



More AI Ai Tools tools
Other tools in the same category, for when this one is not quite the fit.

Free
Pogo Travel
Pogo Travel is an AI-driven platform that generates personalized travel itineraries based on your preferences, travel dates, and interests, offering collaborative planning and offline access.
Freemium
PlaninGo
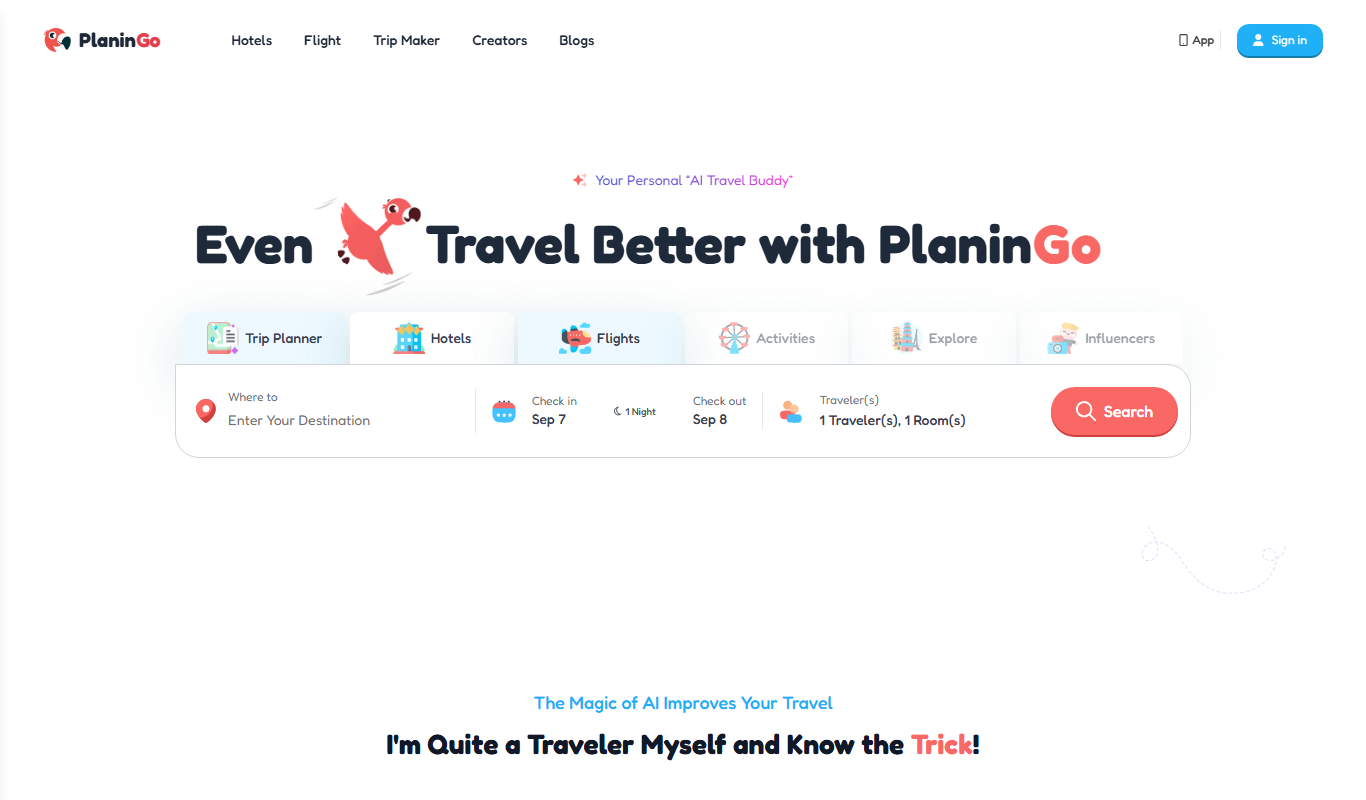
PlaninGo is an AI travel planning tool that generates personalized trip itineraries and guides based on your preferences, helping you plan efficient and enjoyable trips.

Free
Travelwiz
Travelwiz is an AI-powered travel planning tool that creates personalized trip itineraries and offers tailored travel recommendations based on user preferences.

Free
Momo
Momo is an AI-powered assistant that automates workflows, manages tasks, and enhances team collaboration by integrating with popular productivity tools.

Free
Nextrip
Nextrip AI is an online travel planning tool that uses artificial intelligence to generate personalized trip itineraries based on your preferences, travel dates, and destinations.

Freemium
TravelBot AI Travel Assistant
TravelBot AI Travel Assistant is a web-based platform that uses artificial intelligence to help users create personalized travel itineraries, book flights and hotels, and receive tailored travel recommendations based on preferences and budget.
Freemium
AIreelity
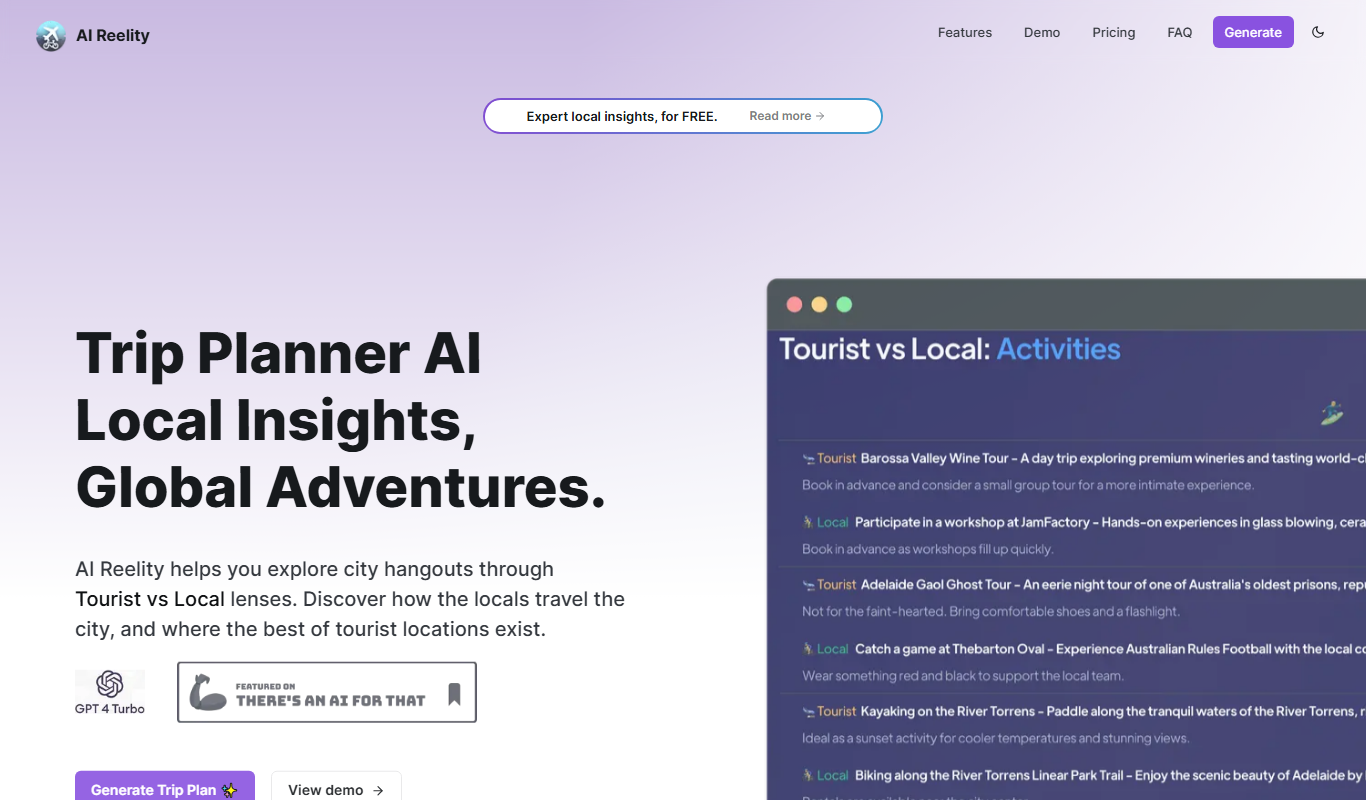
AIreelity is an AI-driven video creation platform that transforms text scripts into engaging marketing videos with customizable templates and AI voiceovers.

Free
AIJOURNEY
AIJOURNEY is an AI-driven career development tool that provides personalized career path recommendations, identifies skill gaps, and offers curated learning resources to help users advance professionally.