

From my experience with AI Graph Maker, I found it excels at simplifying the graph creation process for users without technical backgrounds. The tool’s AI-assisted approach makes it easy to generate clear and visually appealing charts quickly, which is great for students, educators, and small business owners who need fast data visualization without complexity. However, the trade-off is that it lacks advanced customization and integration features that power users might expect. Overall, if you need a straightforward, free online tool to create common graph types efficiently, AI Graph Maker delivers solid results.
AI Graph Maker - Create Data Visualizations with AI Assistance Online
AI Graph Maker is a free web-based tool that uses AI to help users quickly create and customize various types of graphs and charts from their data without needing advanced skills.
- Best for
- Quick Graph Creation
- Key capability
- AI-Powered Graph Generation

Do you recommend this tool?
What is AI graph maker?
AI Graph Maker is a free online tool that leverages artificial intelligence to help users create graphs and charts effortlessly. It simplifies the process of data visualization by allowing users to input data and automatically generate clear, customizable graphs suitable for various purposes such as presentations, reports, and educational materials.
Key features of AI graph maker
The tool offers an intuitive interface for creating multiple types of graphs including bar charts, line graphs, pie charts, and scatter plots. It supports easy data input, automatic graph generation, and customization options to tailor the visual output to user needs.
AI-Powered Graph Generation
Automatically creates graphs from raw data with minimal user input.
Multiple Graph Types
Supports bar, line, pie, scatter, and other common chart formats.
User-Friendly Interface
Simple and clean design that makes graph creation accessible to all skill levels.
Customization Options
Allows users to modify colors, labels, and styles to fit their presentation needs.
Free to Use
No cost to create and download graphs, making it accessible for individuals and small teams.
Pros and cons of AI graph maker
Pros
- Completely free with no signup required
- Easy and fast graph generation
- Supports multiple common graph types
- Simple interface accessible to beginners
Cons
- Limited advanced customization options
- No mobile app or offline version available
- Lacks integration with other data tools
Key use cases for AI graph maker
Quick Graph Creation
Generate various types of graphs and charts quickly without manual plotting.
Data Presentation
Create visual data representations for reports, presentations, and analysis.
Educational Use
Assist students and educators in visualizing data concepts easily.
Business Analytics
Support business decision-making by visualizing key metrics and trends.
How AI graph maker works
- 1
Input Data
Enter your dataset manually or upload it to the platform.
- 2
Select Graph Type
Choose the desired graph or chart style from available options.
- 3
Generate Graph
The AI processes the data and creates a visual graph automatically.
- 4
Customize and Export
Adjust colors, labels, and other settings, then download or share your graph.
Who is using AI graph maker
Students and educators
Small business owners
Content creators
Data enthusiasts
Marketing professionals
AI graph maker pricing
Free
$0
Full access to graph creation features with no subscription required.
Plans and prices are as published by the vendor and can change. Check the official site before you buy. Open the pricing page (opens in a new tab)
Frequently asked questions about AI graph maker
Yes, AI Graph Maker is completely free with no hidden charges.
You can create bar charts, line graphs, pie charts, scatter plots, and more.
No account registration is required to use the basic graph creation features.
Yes, you can adjust colors, labels, and other visual elements before exporting.
It depends on your specific needs and how you plan to use the tool. The official website and documentation are the best sources for the latest details.
Yes, it can help with that use case depending on how you configure it and what features are available. You’ll get the best results with clear inputs and a defined goal.
Yes, it can help with that use case depending on how you configure it and what features are available. You’ll get the best results with clear inputs and a defined goal.
Sign in to review this tool.
Sign In to ReviewNo reviews yet
Be the first to share how this tool worked for you.
Ask about pricing, limits, or how it compares — or answer someone else.
Sign In to AskNo questions yet
Have a question about using or paying for this tool? Be the first to ask.
Featured on TiorAI



Alternative Tools
Explore similar AI tools that might fit your needs

Free
ChartBlocks
ChartBlocks is an online platform that enables users to create, customize, and share a wide variety of charts without coding, supporting data import from multiple sources and offering export options for reports and web embedding.

Free
Infogram
Infogram is a web-based platform that allows users to create interactive infographics, charts, and reports using customizable templates and live data integration without coding skills.
More Data Visualization tools
Other tools in the same category, for when this one is not quite the fit.

Free Trial
Mixflow.AI
Mixflow.AI is an AI-powered analytics platform that transforms data into actionable insights through customizable dashboards, real-time processing, and predictive analytics.
Free
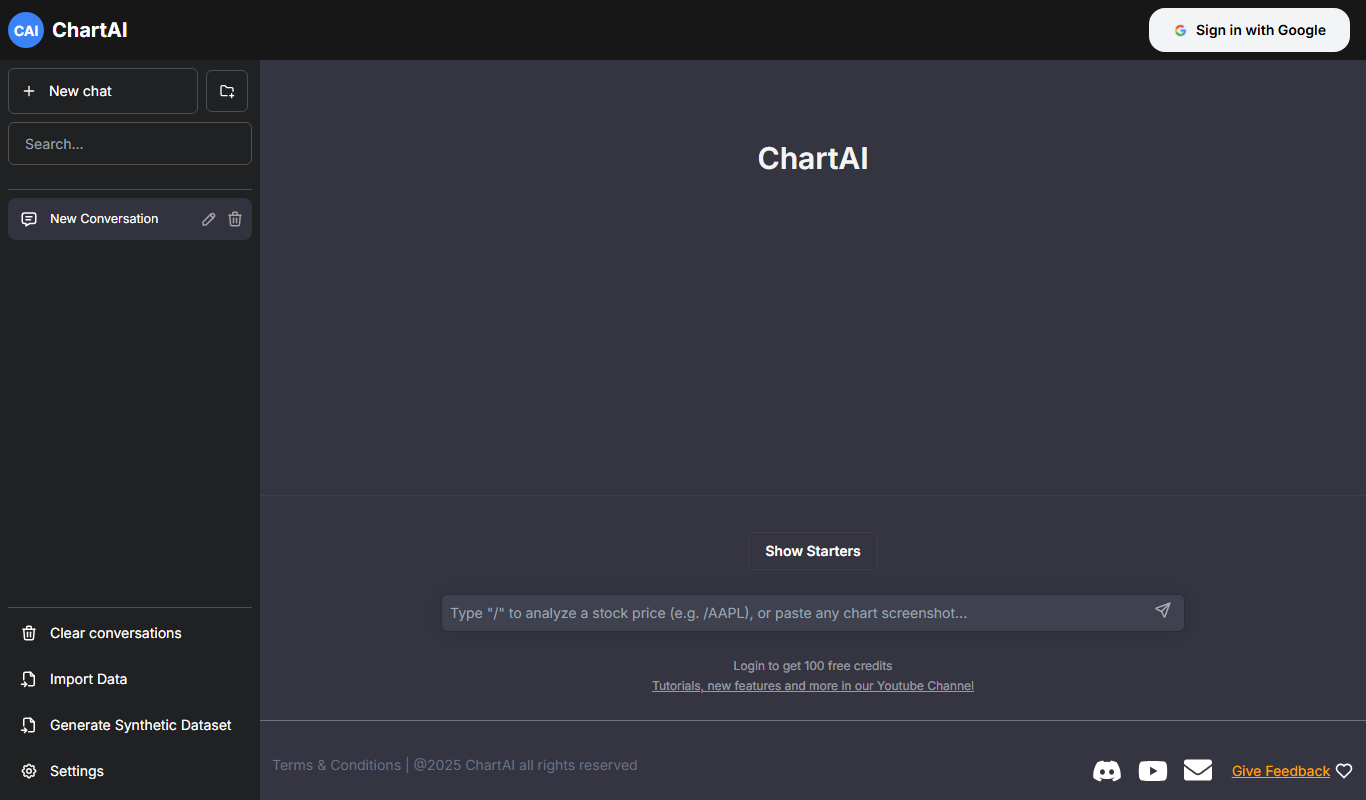
ChartAI
ChartAI is an AI-powered web tool that automatically generates professional charts from raw data, enabling users to visualize information quickly without design expertise.

Free
Hadana.io
Hadana.io is a decentralized blockchain analytics platform that enables users to explore, visualize, and analyze blockchain data interactively with real-time updates and developer APIs.

Free Trial
Stat Pick AI
Stat Pick AI is an AI-based sports analytics platform providing predictive performance insights, real-time data, and customizable dashboards for multiple sports to assist fantasy players, bettors, coaches, and journalists.

Freemium
Graphy for Data Storytelling
Graphy is a web-based platform designed for creating interactive data stories by combining data visualization with narrative elements, enabling users to communicate insights effectively.

Free
Sonify
Sonify is a web platform that converts data into interactive sound and visual experiences, enabling users to explore data through audio sonification without coding skills.

Free
Vizzy
Vizzy is a free web-based AI tool that transforms CSV data into interactive charts and graphs, enabling easy data exploration without coding.

Free Trial
Excel Dashboard Ai
Excel Dashboard AI is a tool that uses artificial intelligence to automate the creation of Excel dashboards and reports, enabling users to quickly generate professional data visualizations without advanced Excel skills.