

From my experience with Graphia AI, I found it excels at handling and visualizing extremely large and complex datasets with ease. Its interactive interface combined with AI-driven analysis tools makes uncovering hidden patterns and communities straightforward, especially for scientific and research applications. However, the platform does have a steeper learning curve for those unfamiliar with graph theory concepts, and pricing transparency is limited as it requires direct contact. Overall, if your work involves network data or complex relationships, Graphia AI offers a robust and scalable solution for deep data exploration.
Graphia AI Visual Data Analysis Platform for Network and Graph Insights
Graphia AI is a visual data analysis platform that transforms complex datasets into interactive network graphs, enabling users to explore and analyze relationships with AI-powered insights.
- Best for
- Scientific Research
- Key capability
- High-Performance Graph Visualization

Do you recommend this tool?
What is Graphia AI?
Graphia AI is a powerful visual data analysis platform designed to transform complex datasets into interactive graph visualizations. It enables users to explore, analyze, and interpret relationships within large-scale data through intuitive network graphs. The tool is widely used in scientific research, healthcare, and other data-intensive fields to reveal patterns and insights that traditional analysis methods might miss.
Key features of Graphia AI
Graphia AI offers advanced graph visualization, dynamic clustering, AI-assisted pattern recognition, and scalable handling of large datasets. Its interactive interface allows users to manipulate and explore networks in real time, facilitating deeper understanding of data structures.
High-Performance Graph Visualization
Render and manipulate large-scale graphs with millions of nodes and edges efficiently.
Dynamic Clustering and Community Detection
Automatically identify clusters and communities within networks to reveal meaningful groupings.
AI-Powered Pattern Recognition
Leverage AI algorithms to uncover hidden patterns and relationships in complex datasets.
Customizable Visual Interface
Tailor graph appearance and interaction settings to suit specific analysis needs.
Multi-Format Data Support
Import data from various sources and formats to build comprehensive network models.
Pros and cons of Graphia AI
Pros
- Handles large and complex datasets efficiently
- Interactive and customizable graph visualizations
- AI-assisted analysis enhances insight discovery
- Supports diverse scientific and business applications
Cons
- Pricing details require direct contact, limiting upfront transparency
- Steeper learning curve for users unfamiliar with graph theory
Key use cases for Graphia AI
Scientific Research
Analyze complex biological and scientific data sets through network visualization to identify patterns and relationships.
Data Exploration
Explore large datasets visually to uncover hidden structures, clusters, and connections using graph-based analytics.
Knowledge Discovery
Facilitate discovery of insights in diverse domains such as healthcare, finance, and social networks by mapping data relationships.
Network Analysis
Perform detailed network topology analysis to understand connectivity, centrality, and community structures.
How Graphia AI works
- 1
Data Import
Users upload or connect their datasets to Graphia AI, supporting various data formats suitable for graph construction.
- 2
Graph Construction
The platform transforms raw data into network graphs, mapping nodes and edges to represent entities and their relationships.
- 3
Interactive Exploration
Users interact with the visual graph, applying filters, zooming, and clustering to explore data patterns and structures.
- 4
AI-Driven Analysis
Graphia AI applies machine learning techniques to detect communities, anomalies, and significant connections within the network.
- 5
Export and Reporting
Insights and visualizations can be exported for reporting, presentations, or further analysis.
Who is using Graphia AI
Scientific researchers
Data scientists
Healthcare analysts
Financial analysts
Academic institutions
Enterprise data teams
Graphia AI pricing
Standard
Contact for pricing
Access to core features suitable for individual researchers and small teams.
Enterprise
Contact for pricing
Advanced capabilities, dedicated support, and customization options for organizations.
Plans and prices are as published by the vendor and can change. Check the official site before you buy. Open the pricing page (opens in a new tab)
Frequently asked questions about Graphia AI
Graphia AI can analyze any data that can be represented as networks, including biological data, social networks, financial transactions, and more.
While designed with researchers in mind, Graphia AI offers an intuitive interface that can be used by users with basic data analysis knowledge.
Yes, Graphia AI is optimized to efficiently visualize and analyze graphs with millions of nodes and edges.
Graphia AI supports data import/export in multiple formats, enabling integration with various data processing pipelines.
This tool is designed to help users accomplish its core tasks more efficiently. It is typically used by individuals or teams looking to improve productivity and workflow.
Data handling and security practices vary by provider. Review the official privacy policy to understand how your data is stored and used.
It depends on your specific needs and how you plan to use the tool. The official website and documentation are the best sources for the latest details.
It depends on your specific needs and how you plan to use the tool. The official website and documentation are the best sources for the latest details.
Sign in to review this tool.
Sign In to ReviewNo reviews yet
Be the first to share how this tool worked for you.
Ask about pricing, limits, or how it compares — or answer someone else.
Sign In to AskNo questions yet
Have a question about using or paying for this tool? Be the first to ask.
Featured on TiorAI



Alternative Tools
Explore similar AI tools that might fit your needs

Free
Gephi
Gephi is a free, open-source software for visualizing and analyzing complex networks and graphs, widely used in research and data science.

Free
Cytoscape
Cytoscape is a free, open-source software platform designed for visualizing complex networks and integrating attribute data, widely used in bioinformatics and data analysis.
More Data Visualization tools
Other tools in the same category, for when this one is not quite the fit.

Free Trial
Mixflow.AI
Mixflow.AI is an AI-powered analytics platform that transforms data into actionable insights through customizable dashboards, real-time processing, and predictive analytics.

Free
AI graph maker
AI Graph Maker is a free web-based tool that uses AI to help users quickly create and customize various types of graphs and charts from their data without needing advanced skills.
Free
ChartAI
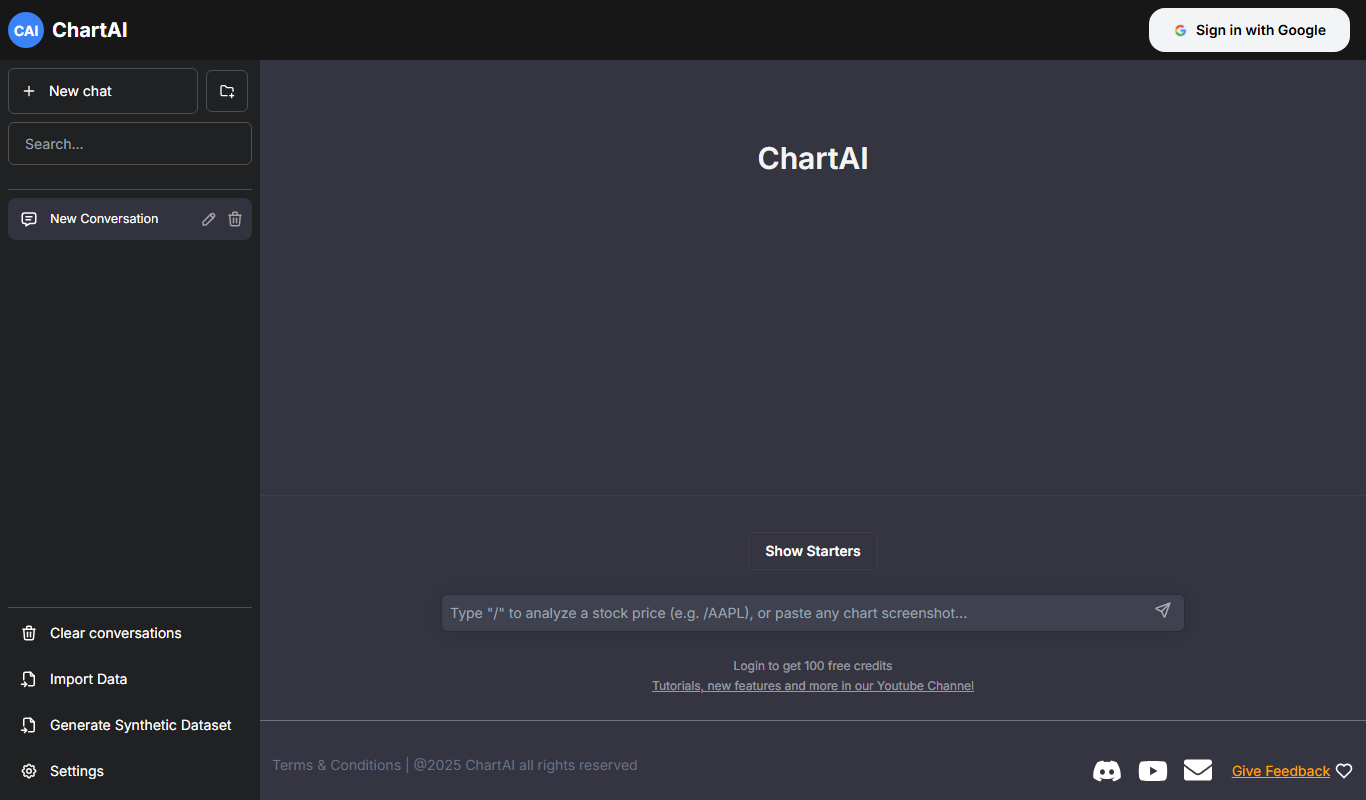
ChartAI is an AI-powered web tool that automatically generates professional charts from raw data, enabling users to visualize information quickly without design expertise.

Free
Hadana.io
Hadana.io is a decentralized blockchain analytics platform that enables users to explore, visualize, and analyze blockchain data interactively with real-time updates and developer APIs.

Free Trial
Stat Pick AI
Stat Pick AI is an AI-based sports analytics platform providing predictive performance insights, real-time data, and customizable dashboards for multiple sports to assist fantasy players, bettors, coaches, and journalists.

Freemium
Graphy for Data Storytelling
Graphy is a web-based platform designed for creating interactive data stories by combining data visualization with narrative elements, enabling users to communicate insights effectively.

Free
Sonify
Sonify is a web platform that converts data into interactive sound and visual experiences, enabling users to explore data through audio sonification without coding skills.

Free
Vizzy
Vizzy is a free web-based AI tool that transforms CSV data into interactive charts and graphs, enabling easy data exploration without coding.