

Descriptive Statistics Calculator
Paste a set of numbers and get the full descriptive summary — central tendency, dispersion, quartiles, and outliers — in one table.
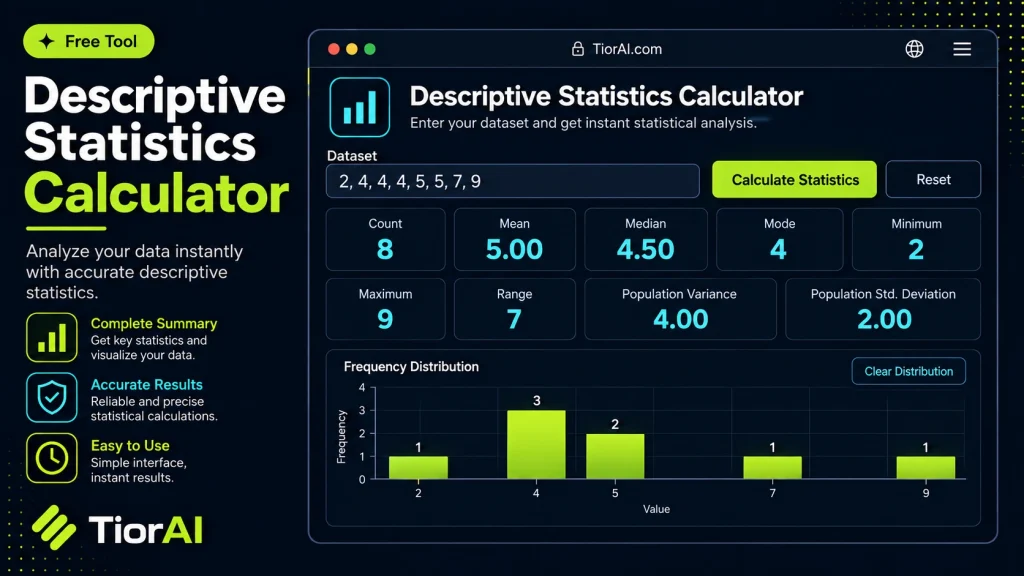
Negatives, decimals, and scientific notation are all accepted.
Population or Sample, and How the Quartiles Are Found
Both variance figures are reported because the right one depends on what your numbers represent. Use the population value when the data is the whole group you care about. Use the sample value when the data is a subset you are using to estimate a larger group — it divides by n−1 instead of n, which corrects the bias that comes from measuring only part of the whole.
- Median
- The middle value once sorted. With an even count it is the mean of the two middle values.
- Q1 / Q3
- The medians of the lower and upper halves, excluding the overall median when the count is odd. This is the exclusive (Tukey) method used in most textbooks.
- IQR
- Q3 minus Q1 — the spread of the middle half of the data, unaffected by extreme values.
- Outliers
- Values more than 1.5 × IQR below Q1 or above Q3. Flagged for review, not automatically wrong.
- Coefficient of variation
- Standard deviation as a percentage of the mean, which lets you compare the spread of data measured on different scales.
How to use it
- Enter Your Values Input your numbers or parameters into the Descriptive Statistics Calculator. Fill in all required fields for an accurate calculation.
- Calculate Results Click the calculate button to process your inputs. The Descriptive Statistics Calculator delivers instant, accurate results.
- Review and Use Review your calculated results, explore the breakdown, and copy or share the output for your needs.
Tip Share your Descriptive Statistics Calculator results by copying the output — great for reports, homework, or team discussions.
Understanding Descriptive Statistics
Descriptive statistics summarize and describe the main features of a dataset. Instead of analyzing relationships or making predictions, descriptive statistics provide a clear snapshot of the data’s distribution, central tendency, and variability. This includes measures such as the mean (average), median (middle value), mode (most frequent value), range (difference between max and min), variance, and standard deviation.
These statistics are essential because they simplify large datasets into understandable numbers, making it easier to interpret and communicate data insights. For example, a teacher might use descriptive statistics to summarize students’ test scores, or a business analyst might evaluate sales data to understand typical performance.
Common uses include:
- Summarizing survey results to identify trends
- Checking data quality and spotting outliers
- Preparing data for further statistical analysis
- Reporting key metrics in research or business contexts
Descriptive statistics do not infer or predict but provide foundational knowledge about the data’s characteristics. They are often the first step in any data analysis process.
What Are Descriptive Statistics?
Descriptive statistics provide a way to summarize and describe the main features of a dataset. They include measures such as the mean, median, mode, range, variance, and standard deviation. These statistics help you understand the central tendency and variability of your data without making predictions or inferences.
For example, if you have a list of test scores, descriptive statistics can tell you the average score, the most common score, and how spread out the scores are. This is useful in many fields, including education, business, and research.
When to Use a Descriptive Statistics Calculator
- When you want a quick summary of your data’s key characteristics before deeper analysis.
- To check the distribution and spread of data collected from surveys or experiments.
- When preparing reports that require clear numerical summaries.
- To identify outliers or data entry errors by examining range and standard deviation.
Common Mistakes to Avoid
- Entering data with inconsistent formats or including non-numeric values without cleaning the data first.
- Misinterpreting descriptive statistics as inferential statistics or assuming they imply causation.
- Ignoring outliers that can skew results like the mean and standard deviation.
Using a descriptive statistics calculator correctly ensures you get accurate summaries that help you understand your data better. Always prepare your data carefully and interpret the results within the right context.
Frequently asked questions
Reviews and questions
Whether this tool gave people the answer they needed, and what they asked about it.
Sign in to review this tool.
Sign In to ReviewNo reviews yet
Be the first to say whether this tool gave you what you needed.
Ask how to read the result, or what the tool does with an edge case — or answer someone else.
Sign In to AskNo questions yet
Not sure how to read a result? Be the first to ask.