

Freemium
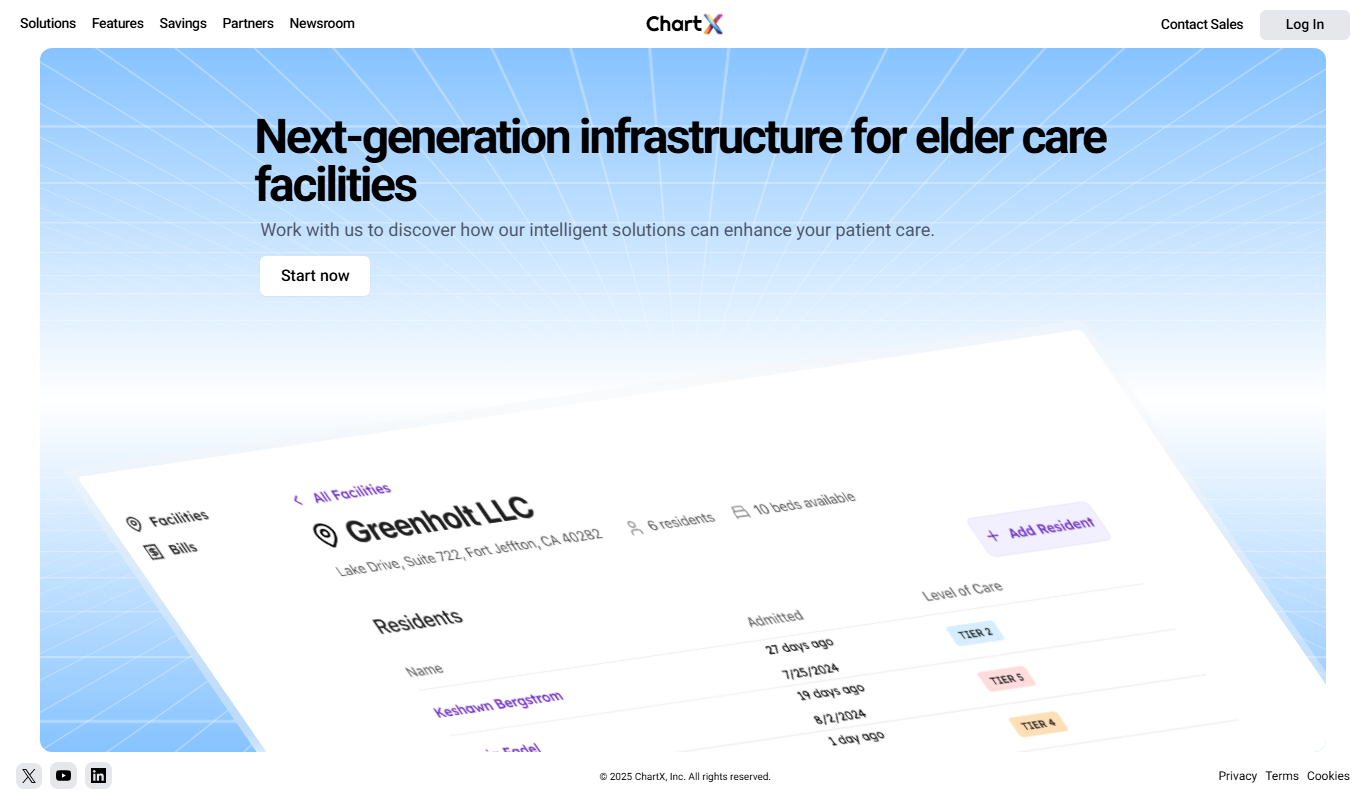
ChartX
ChartX is an AI-driven data visualization tool that simplifies creating interactive charts and dashboards by recommending optimal visualizations and enabling real-time data integration.
25 tools in this category. Filter by pricing, platform or language to narrow the list.
ChartX is an AI-driven data visualization tool that simplifies creating interactive charts and dashboards by recommending optimal visualizations and enabling real-time data integration.

Flame Analytics is a web-based platform that enables businesses to analyze data through real-time dashboards and customizable reports, helping them make informed decisions.

VMind is an open-source JavaScript visual component library by VisActor designed for creating intelligent, interactive data visualizations on the web.
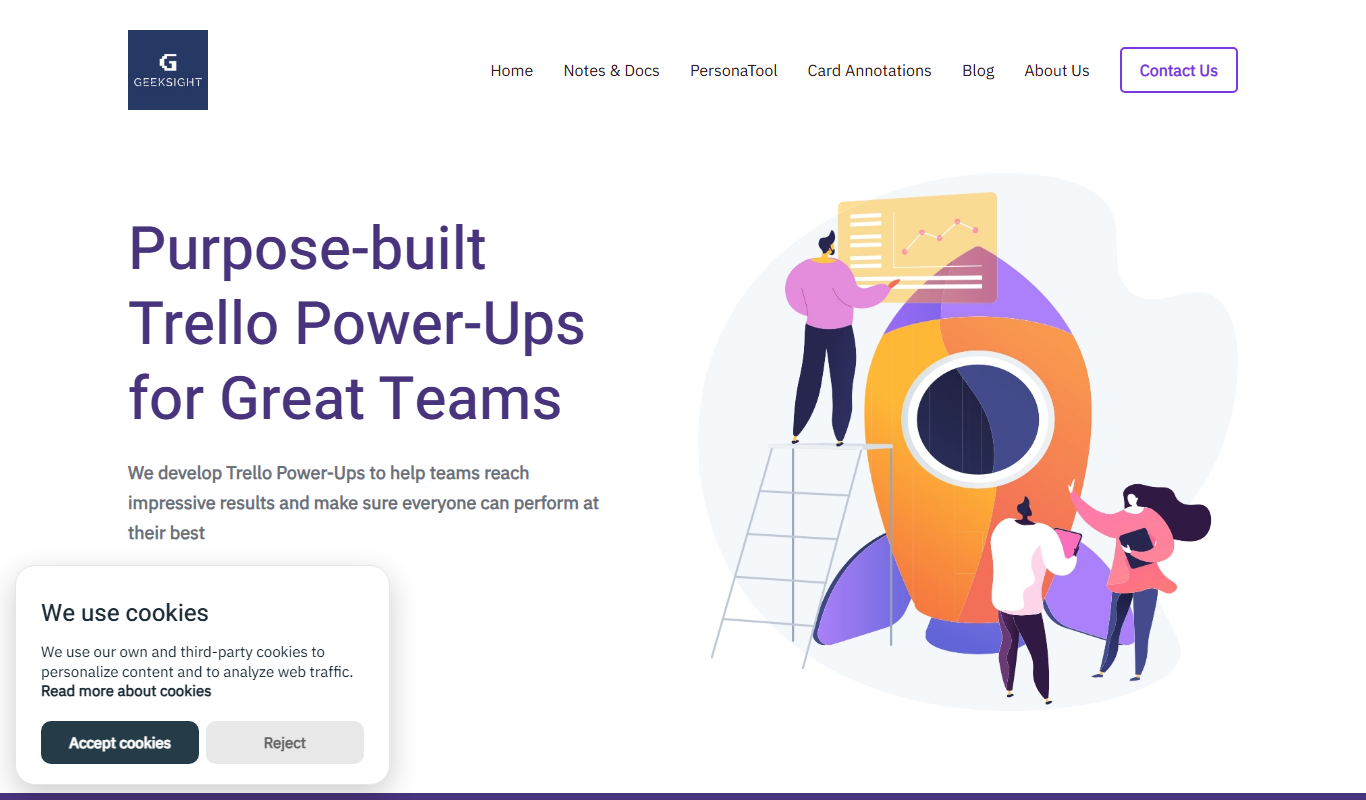
Geeksight is an AI-driven analytics platform that helps businesses integrate data from multiple sources, create customizable dashboards, and leverage predictive analytics to make informed decisions.

VisualizeAI is a web-based AI-powered data visualization platform that enables users to create interactive dashboards, integrate multiple data sources, and leverage AI insights for better data analysis.
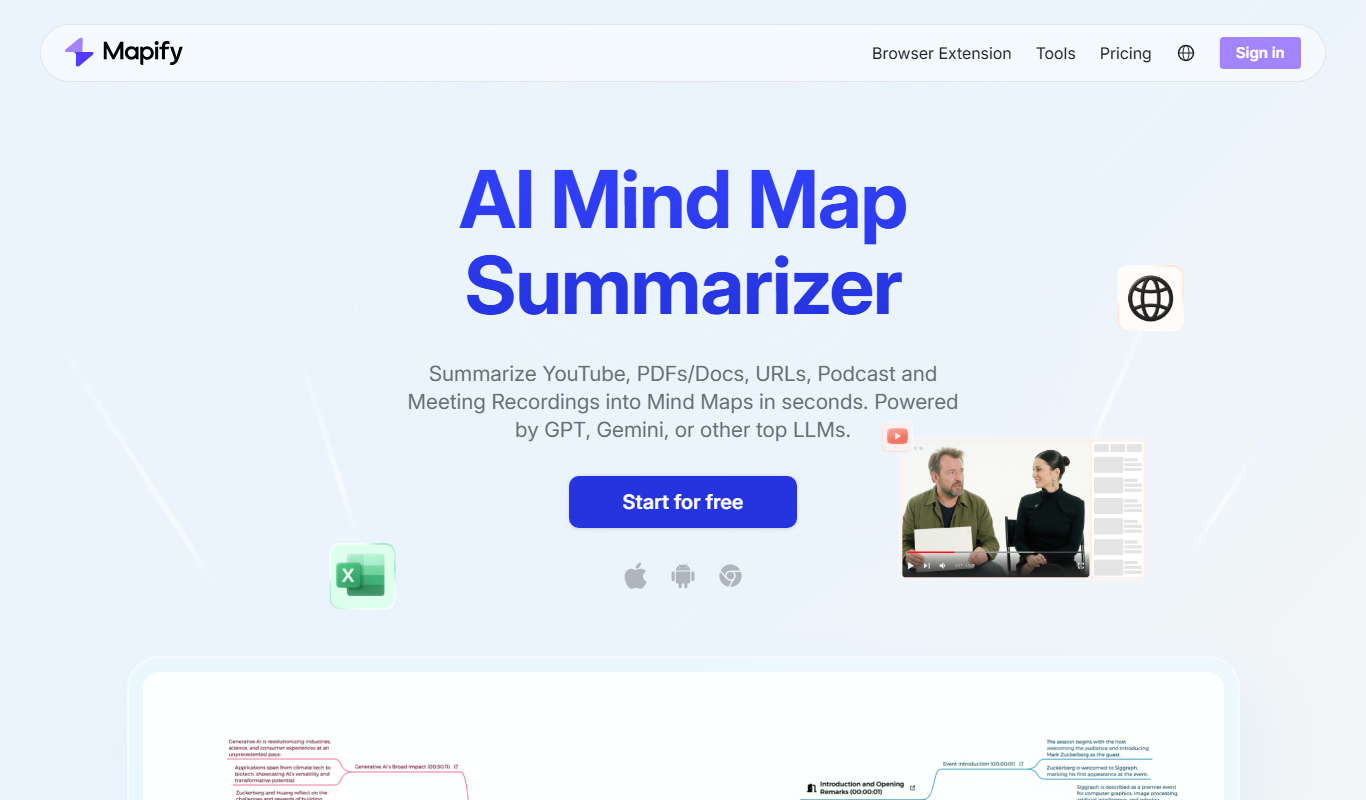
Mapify is a web-based tool that allows users to create interactive maps with multimedia content, ideal for storytelling, education, and business visualization without coding.
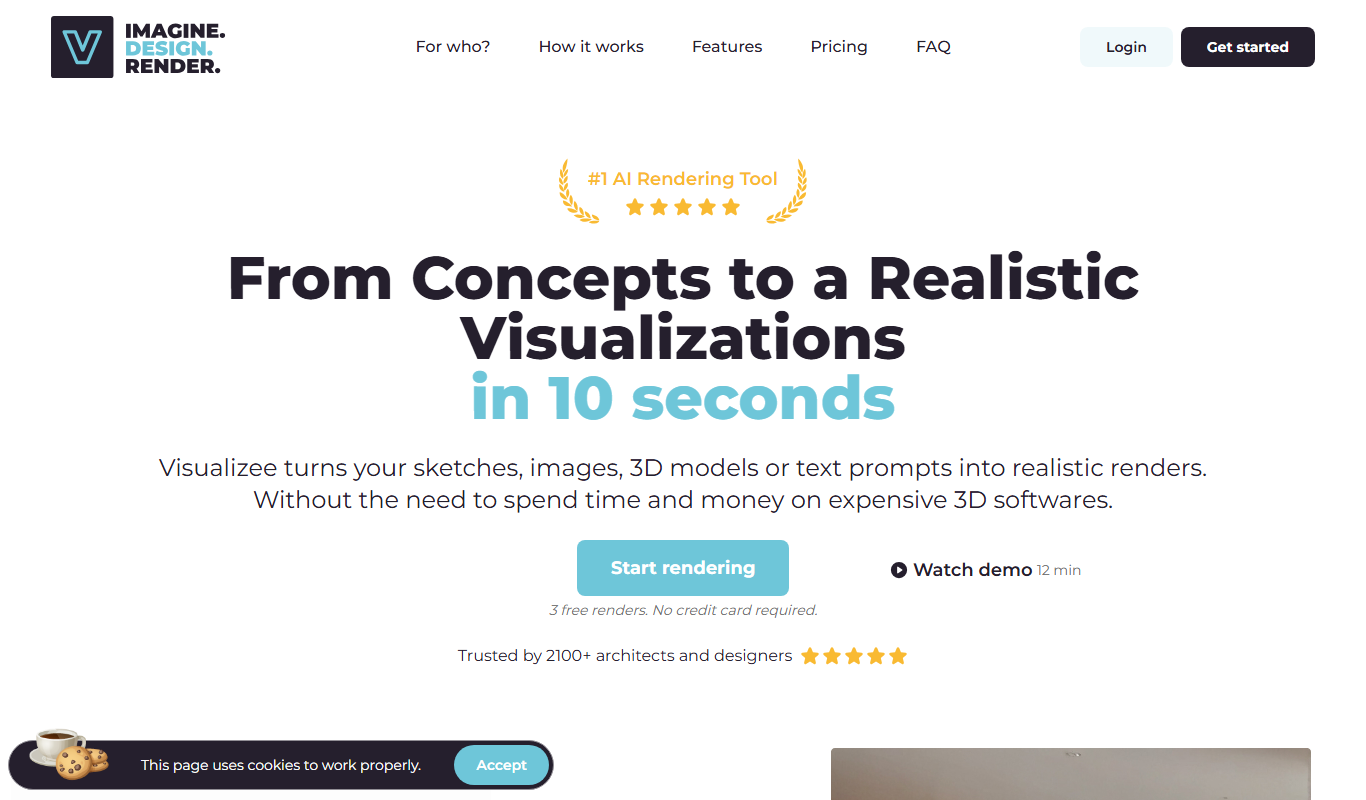
Visualizee.ai is an AI-powered platform that transforms raw data into interactive charts and graphs, simplifying data visualization for business and educational purposes.

InsightAI is an AI-driven analytics platform that enables businesses to analyze data, generate predictive insights, and visualize key metrics through customizable dashboards.
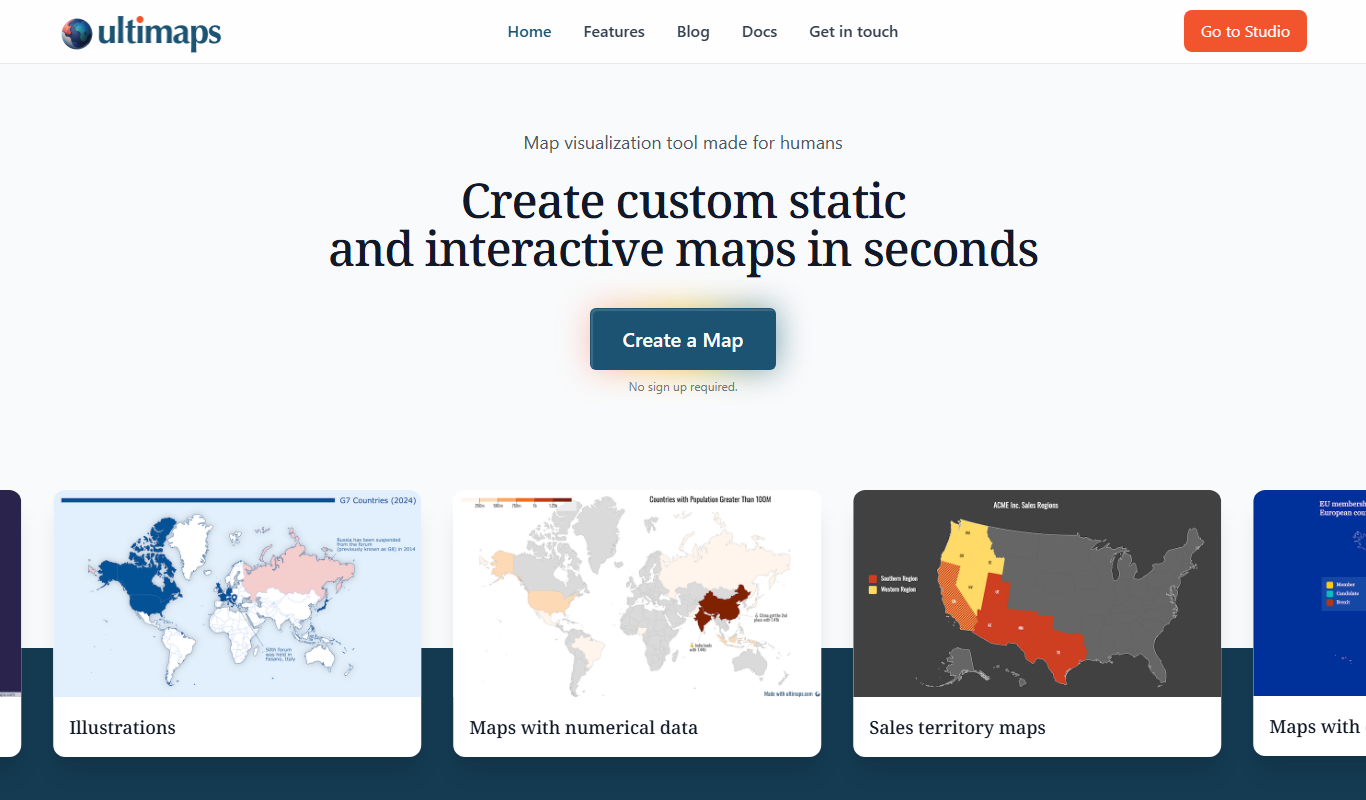
Ultimaps is an AI-driven platform that helps users create interactive maps and analyze geographic data for better location intelligence and decision-making.

Infranodus is a web-based tool that converts text into interactive network graphs, helping users analyze and visualize relationships between concepts to uncover insights and thematic clusters.

Rush Analytics is a web analytics platform that provides detailed visitor behavior insights through heatmaps, session recordings, and conversion tracking to help businesses optimize their websites.

ChartPixel is a web-based platform that enables users to create interactive and customizable charts and dashboards from their data, supporting real-time updates and easy sharing.
Page 2 of 3