

From my experience with Visualizee.ai, I found it excels at simplifying data visualization through AI-powered chart recommendations and interactive features. The platform is particularly well-suited for business analysts and educators who need to create clear, engaging visual reports without deep technical expertise. However, it currently lacks some advanced analytics capabilities found in more comprehensive BI tools, and it does not offer a mobile app. Overall, if your goal is to quickly generate insightful and shareable visualizations with ease, Visualizee.ai delivers a practical and user-friendly solution.
Visualizee.ai AI Data Visualization Tool for Interactive Charts and Graphs
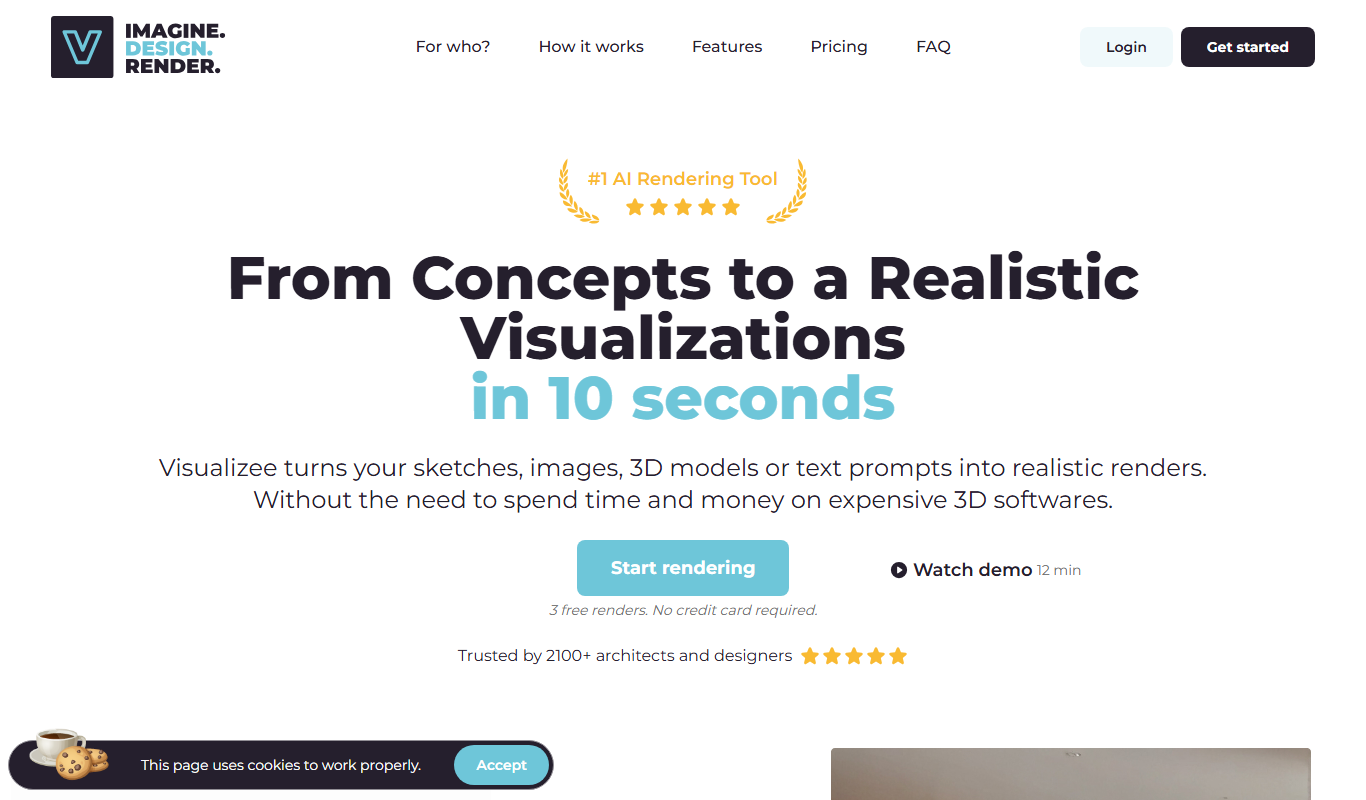
Visualizee.ai is an AI-powered platform that transforms raw data into interactive charts and graphs, simplifying data visualization for business and educational purposes.
- Best for
- Business Reporting
- Key capability
- AI-Powered Chart Suggestions
Do you recommend this tool?
What is Visualizee.ai?
Visualizee.ai is an AI-driven data visualization platform that helps users transform raw data into interactive charts and graphs. It leverages artificial intelligence to simplify the creation of insightful visual reports, enabling users to communicate data stories effectively without needing advanced technical skills.
Key features of Visualizee.ai
The tool offers a variety of chart types, AI-assisted data interpretation, customizable visual templates, and easy sharing options to enhance data presentation and collaboration.
AI-Powered Chart Suggestions
Automatically recommends optimal chart types based on your data characteristics.
Interactive Visualizations
Create charts that users can explore dynamically for deeper understanding.
Customizable Templates
Use and modify pre-built templates to match branding and presentation needs.
Data Import Flexibility
Supports multiple data formats for seamless integration.
Easy Sharing and Collaboration
Share visualizations via links or embed them in websites and presentations.
Pros and cons of Visualizee.ai
Pros
- User-friendly AI-assisted visualization creation
- Supports interactive and customizable charts
- Flexible data import options
- Easy sharing and embedding capabilities
Cons
- Limited advanced analytics features compared to specialized BI tools
- No mobile app currently available
Key use cases for Visualizee.ai
Business Reporting
Create dynamic and interactive charts to present business data clearly for stakeholders.
Data Analysis
Visualize complex datasets to uncover trends and insights using AI-powered tools.
Marketing Analytics
Generate visual reports to track campaign performance and customer engagement.
Educational Presentations
Design engaging visual aids for teaching data concepts and statistics.
How Visualizee.ai works
- 1
Upload Data
Import your datasets in supported formats such as CSV or Excel.
- 2
Select Visualization Type
Choose from multiple chart and graph options tailored to your data.
- 3
AI-Assisted Insights
Leverage AI to automatically suggest the best visualization and highlight key trends.
- 4
Customize and Share
Adjust design elements and share your interactive visualizations with others.
Who is using Visualizee.ai
Business analysts
Marketing professionals
Educators and trainers
Small to medium enterprises
Data enthusiasts
Visualizee.ai pricing
Free
$0/month
Access to basic visualization features with limited data uploads and templates.
Pro
$15/month
Expanded data limits, advanced AI features, and premium templates.
Enterprise
Custom pricing
Tailored solutions with dedicated support and collaboration tools.
Plans and prices are as published by the vendor and can change. Check the official site before you buy. Open the pricing page (opens in a new tab)
Frequently asked questions about Visualizee.ai
Visualizee.ai supports CSV, Excel, and other common spreadsheet formats for data import.
Yes, you can share interactive charts via links or embed them in websites and presentations.
Yes, Visualizee.ai offers a free plan with basic features and limited data capacity.
Data handling and security practices vary by provider. Review the official privacy policy to understand how your data is stored and used.
Yes, it can help with that use case depending on how you configure it and what features are available. You’ll get the best results with clear inputs and a defined goal.
It depends on your specific needs and how you plan to use the tool. The official website and documentation are the best sources for the latest details.
Sign in to review this tool.
Sign In to ReviewNo reviews yet
Be the first to share how this tool worked for you.
Ask about pricing, limits, or how it compares — or answer someone else.
Sign In to AskNo questions yet
Have a question about using or paying for this tool? Be the first to ask.
Featured on TiorAI



More AI Artificial Intelligence Tools tools
Other tools in the same category, for when this one is not quite the fit.
Freemium
EasyTrip AI
EasyTrip AI is an AI-driven travel planner that generates customized trip itineraries based on your travel dates, destinations, and preferences, helping you organize your trip efficiently.

Freemium
Travel Itinerary AI
Travel Itinerary AI is an AI-powered web tool that creates personalized travel itineraries based on your preferences, helping you plan and manage trips efficiently.

Free
NilgAI Travel
NilgAI Travel is an AI-driven travel planning tool that creates personalized itineraries based on your preferences, travel dates, and budget, helping you efficiently plan trips worldwide.

Custom Pricing
sentiance.com
Sentiance is an AI-powered platform that transforms sensor and contextual data into actionable behavioral insights, enabling businesses to understand user behavior and deliver personalized experiences in real-time.

Contact for pricing
ODESIS
ODESIS is an AI-driven analytics platform that helps businesses transform data into actionable insights through machine learning, visualization, and predictive analytics.

Contact for pricing
QUINETICS
Quinetics is an AI platform that provides businesses with advanced data analytics, workflow automation, and custom machine learning model development to optimize operations and decision-making.

Free
aigclist
AIGCList is a free online directory that aggregates and categorizes AI tools, providing detailed information, user reviews, and AI industry news to help users discover and compare AI solutions.

Free
AI Tool Center
AI Tool Center is a free online directory that helps users discover, compare, and review AI tools across various categories and industries.