

From my experience with Mappie AI Beta, I found it excels at simplifying complex data visualization through AI automation. The platform’s intuitive interface makes it accessible even for users without technical backgrounds, allowing quick transformation of raw data into interactive maps. This makes it particularly well-suited for business analysts, researchers, and marketers who need to explore data visually without steep learning curves. However, as a beta product, it currently lacks some advanced analytics features and mobile support, which may limit use in more demanding scenarios. Overall, if your goal is to quickly generate insightful visual maps from your data, Mappie AI Beta offers a practical and user-friendly solution.
Mappie AI Beta - AI-Powered Visual Data Mapping and Analysis Tool
Mappie AI Beta is a web-based AI tool that transforms raw data into interactive visual maps, enabling users to explore and analyze data easily without technical expertise.
- Best for
- Visual Data Exploration
- Key capability
- Automated Data Visualization
Your actions
Save Mappie AI (Beta), follow its updates and vote on it — everything stays in your account.
Sign in or create a free account

What is Mappie AI (Beta)?
Mappie AI (Beta) is a web-based AI-powered platform designed to convert raw data into interactive, easy-to-understand visual maps. It leverages artificial intelligence to automate the creation of data visualizations, enabling users to explore and analyze complex datasets without requiring advanced technical skills.
Key features of Mappie AI (Beta)
The tool offers automated data mapping, customizable visualizations, real-time interaction with data points, and AI-driven insights to highlight significant trends and anomalies within datasets.
Automated Data Visualization
AI-driven generation of visual maps reduces manual effort and speeds up data exploration.
Interactive Maps
Users can zoom, filter, and click on data points to explore underlying information dynamically.
Customizable Visual Styles
Various themes and visualization options allow tailoring maps to specific presentation needs.
Insight Highlighting
The AI identifies and emphasizes important trends, outliers, and correlations within the data.
Data Import Flexibility
Supports common data formats like CSV and Excel for easy integration.
Pros and cons of Mappie AI (Beta)
Pros
- User-friendly interface with minimal learning curve
- AI automates complex data visualization tasks
- Interactive maps enhance data exploration
- Supports common data formats for easy upload
Cons
- Currently in beta, some features may be limited
- Limited advanced analytics compared to specialized BI tools
- No mobile app available yet
Key use cases for Mappie AI (Beta)
Visual Data Exploration
Users can transform complex datasets into interactive visual maps to uncover patterns and insights quickly.
Business Intelligence Reporting
Create compelling visual reports that help stakeholders understand data trends and make informed decisions.
Market Research Analysis
Analyze geographic and demographic data visually to identify market opportunities and customer segments.
Academic and Scientific Research
Researchers can visualize experimental or survey data to better communicate findings and hypotheses.
How Mappie AI (Beta) works
- 1
Upload Data
Users start by uploading their datasets in supported formats such as CSV or Excel.
- 2
AI Processing
Mappie AI analyzes the data using machine learning algorithms to identify key variables and relationships.
- 3
Generate Visual Maps
The platform automatically creates interactive visual maps tailored to the data’s characteristics.
- 4
Customize and Explore
Users can customize map styles, filter data points, and interact with visual elements to gain deeper insights.
Who is using Mappie AI (Beta)
Data analysts
Business intelligence professionals
Market researchers
Academic researchers
Small to medium businesses
Mappie AI (Beta) pricing
Free
$0/month
Access to core features with limited data size and export options.
Pro
$19/month
Expanded data limits, advanced customization, and priority support.
Plans and prices are as published by the vendor and can change. Check the official site before you buy. Open the pricing page (opens in a new tab)
Frequently asked questions about Mappie AI (Beta)
Mappie AI supports CSV and Excel file formats for data uploads.
Yes, the platform is designed to be user-friendly and does not require advanced technical skills.
Yes, users can adjust map styles, colors, and filters to suit their needs.
The free plan has limits on the size of datasets you can upload and visualize.
It depends on your specific needs and how you plan to use the tool. The official website and documentation are the best sources for the latest details.
Data handling and security practices vary by provider. Review the official privacy policy to understand how your data is stored and used.
Some tools offer a free plan or trial with limited features. Availability can vary, so confirm on the official website.
Yes, it can help with that use case depending on how you configure it and what features are available. You’ll get the best results with clear inputs and a defined goal.
Sign in to review this tool.
Sign In to ReviewNo reviews yet
Be the first to share how this tool worked for you.
Ask about pricing, limits, or how it compares — or answer someone else.
Sign In to AskNo questions yet
Have a question about using or paying for this tool? Be the first to ask.
Featured on TiorAI



Alternative Tools
Explore similar AI tools that might fit your needs
Free
Datawrapper
Datawrapper is a web-based tool that allows users to create interactive charts, maps, and tables from data without coding, ideal for journalists, marketers, and educators.
More AI Artificial Intelligence Tools tools
Other tools in the same category, for when this one is not quite the fit.
Free
DeepAI
DeepAI is an AI platform providing APIs and web tools for image generation, text analysis, and other machine learning tasks, suitable for developers and content creators.

Custom Pricing
berkshiregrey.com
Berkshire Grey provides AI-driven robotic automation systems designed to optimize warehouse and supply chain operations through intelligent picking, packing, and sorting.

Free
Semantic Scholar
Semantic Scholar is a free, AI-driven academic search engine developed by the Allen Institute for AI that helps users find, summarize, and analyze scientific research papers and citations.

Free
EasyNoteAI
EasyNoteAI is an AI-driven tool that automates note taking and summarization, helping users quickly capture and organize information from meetings, lectures, and content.
Free Trial
Low-Code Development and AI
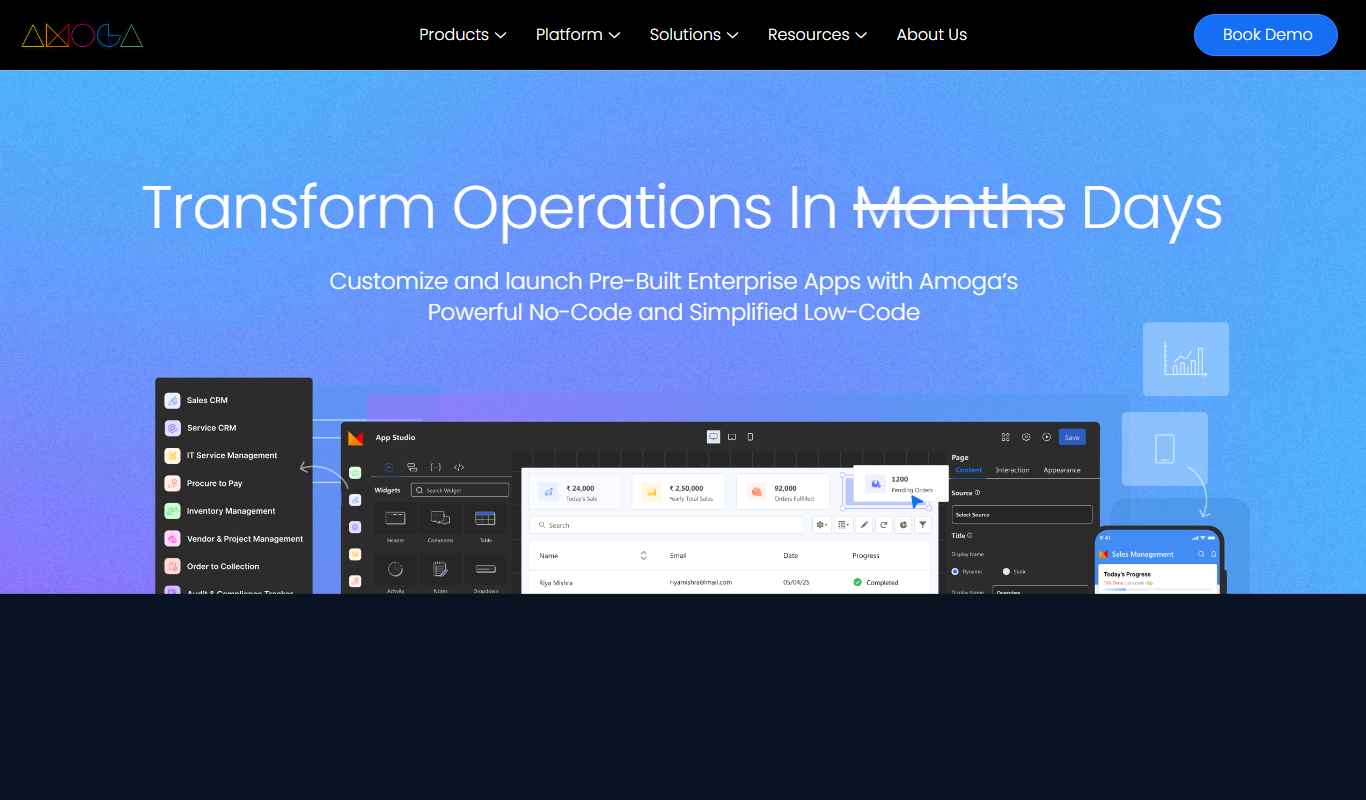
Amoga's Low-Code Development and AI platform enables rapid application building with drag-and-drop tools and AI automation, suitable for users with minimal coding skills.
Free
AI World Today
AI World Today is a free online platform providing daily news, expert analysis, and research updates on artificial intelligence.

Free
Neural Network Tutorial
Neural Network Tutorial by LeapAI is a free web-based platform offering interactive lessons and practical exercises to learn neural networks and deep learning concepts.

Free
debate AI
Debate AI is an online platform where users debate an AI that responds with counterarguments.