

From my experience with ECharts, I found it excels at delivering a comprehensive set of interactive charting options that are both visually appealing and highly customizable. Its open-source nature and active community make it a reliable choice for developers needing flexible data visualization solutions. However, it does require some familiarity with JavaScript and chart configuration, which might present a learning curve for beginners. Overall, if you need to build dynamic, responsive charts for web or mobile applications, ECharts offers a powerful and free toolkit that integrates well with modern development frameworks.
ECharts Interactive Data Visualization Library for Web and Mobile Charts
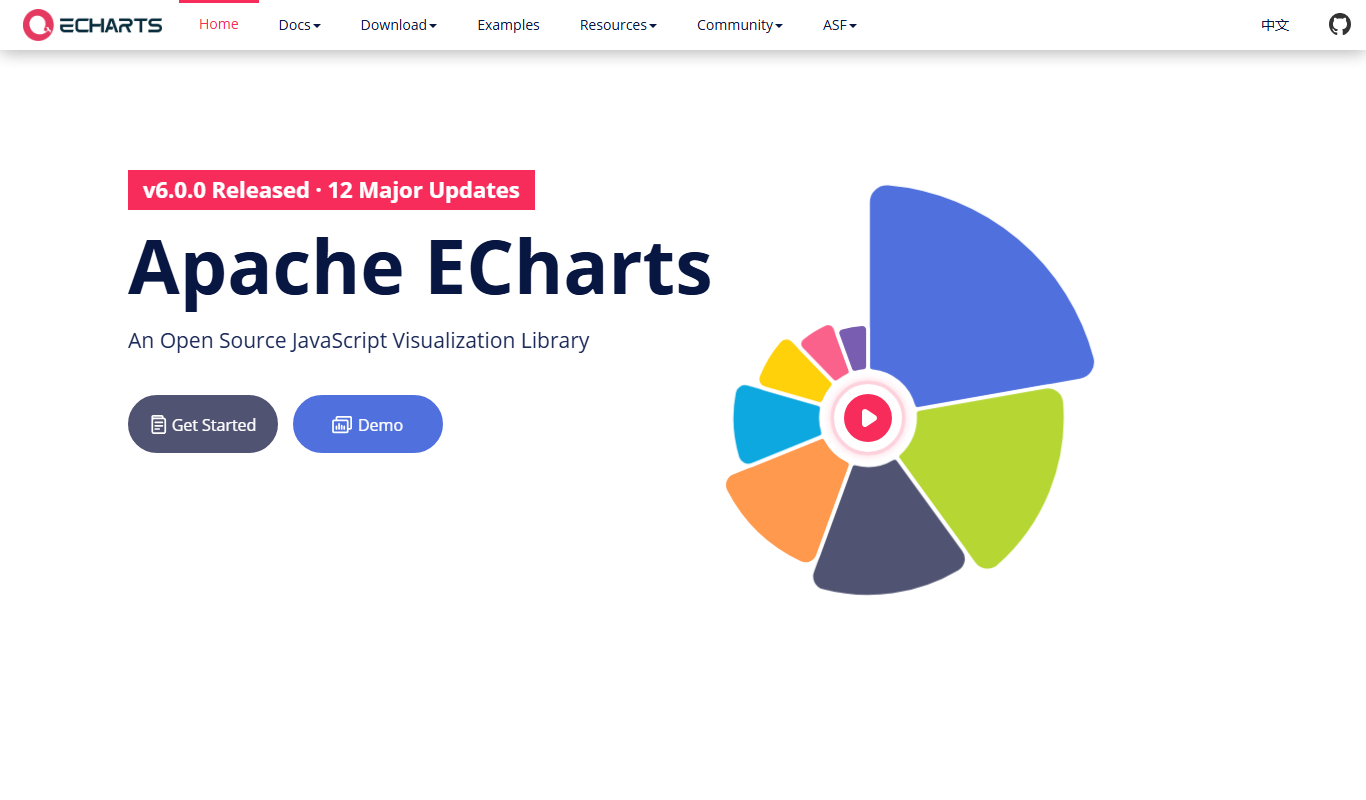
ECharts is an open-source JavaScript library by Apache for creating interactive, customizable charts and data visualizations on web and mobile platforms.
- Best for
- Interactive Data Visualization
- Key capability
- Wide Range of Chart Types
Do you recommend this tool?
What is ECharts?
ECharts is an open-source JavaScript library developed by the Apache Software Foundation for creating interactive, customizable charts and data visualizations on web and mobile platforms. It supports a wide range of chart types including line, bar, pie, scatter, radar, heatmap, and more, leveraging HTML5 Canvas and SVG technologies for high performance and rich interactivity.
Key features of ECharts
ECharts offers extensive chart types, responsive design, rich animation effects, data zooming, tooltips, and flexible configuration options. It is highly extensible and integrates easily with frameworks like React, Vue, and Angular, making it suitable for developers and data analysts seeking powerful visualization tools.
Wide Range of Chart Types
Supports over 20 chart types including line, bar, pie, scatter, candlestick, radar, and heatmap.
Rich Interactivity
Features tooltips, data zoom, data view, brush selection, and responsive animations.
Cross-Platform Compatibility
Works seamlessly on desktop and mobile browsers with responsive design.
Extensibility and Integration
Easily integrates with popular frameworks and supports custom extensions and themes.
Open Source and Free
Licensed under Apache License 2.0, allowing free use and modification.
Pros and cons of ECharts
Pros
- Extensive chart variety with rich customization
- High performance with Canvas and SVG rendering
- Open source with active community support
- Responsive and mobile-friendly design
- Easy integration with modern frameworks
Cons
- Requires JavaScript knowledge to implement
- Documentation can be complex for beginners
- Limited built-in data processing capabilities
Key use cases for ECharts
Interactive Data Visualization
Create dynamic and interactive charts and graphs for web applications to visualize complex data sets.
Business Intelligence Dashboards
Integrate ECharts into BI dashboards to provide real-time data insights with customizable visualizations.
Marketing Analytics
Visualize marketing campaign data and performance metrics to support data-driven decision making.
Scientific Data Presentation
Render scientific and statistical data visually for research presentations and publications.
Custom Reporting Tools
Build tailored reporting interfaces with a variety of chart types and interactive features.
How ECharts works
- 1
Include ECharts Library
Add the ECharts JavaScript library to your web project via CDN or npm package.
- 2
Prepare Data
Format your data according to ECharts’ option structure for the desired chart type.
- 3
Initialize Chart
Create a chart instance by binding ECharts to a DOM element and applying the configuration options.
- 4
Customize and Interact
Use ECharts API to customize appearance, add interactivity like tooltips and zoom, and update data dynamically.
Who is using ECharts
Web developers
Data analysts
Business intelligence professionals
Marketing analysts
Researchers and scientists
ECharts pricing
Free
$0
Full access to all features with open-source license.
Plans and prices are as published by the vendor and can change. Check the official site before you buy. Open the pricing page (opens in a new tab)
Frequently asked questions about ECharts
Yes, ECharts is completely free and open source under the Apache License 2.0.
ECharts supports line, bar, pie, scatter, radar, heatmap, candlestick, funnel, gauge, and more.
Yes, ECharts is designed to be responsive and works well on mobile browsers.
Yes, it integrates with React, Vue, Angular, and other JavaScript frameworks.
This tool is designed to help users accomplish its core tasks more efficiently. It is typically used by individuals or teams looking to improve productivity and workflow.
Some tools offer a free plan or trial with limited features. Availability can vary, so confirm on the official website.
Yes, it can help with that use case depending on how you configure it and what features are available. You’ll get the best results with clear inputs and a defined goal.
Sign in to review this tool.
Sign In to ReviewNo reviews yet
Be the first to share how this tool worked for you.
Ask about pricing, limits, or how it compares — or answer someone else.
Sign In to AskNo questions yet
Have a question about using or paying for this tool? Be the first to ask.
Featured on TiorAI



Alternative Tools
Explore similar AI tools that might fit your needs
Free
Chart.js
Chart.js is an open-source JavaScript library that enables developers to create responsive, animated charts using HTML5 Canvas, supporting multiple chart types like line, bar, pie, and radar for web data visualization.

Free
D3.js
D3.js is an open-source JavaScript library that enables developers to create dynamic, interactive data visualizations on the web using SVG, HTML, and CSS.
More AI Developer Tools tools
Other tools in the same category, for when this one is not quite the fit.

Freemium
Amadeus Travel API
Amadeus Travel API is a developer platform offering RESTful APIs to access global flight, hotel, and travel data for building travel booking and itinerary management applications.

Freemium
Zyte
Zyte is a web scraping platform that enables businesses and developers to extract structured data from websites using smart crawlers, proxy rotation, and API integration to automate data collection at scale.

Enterprise License
NiceLabel
NiceLabel is an enterprise label design and management software that enables businesses to create, manage, and automate barcode and RFID label printing with compliance and integration capabilities.
Perpetual License
Geomagic Design X
Geomagic Design X is a reverse engineering software that converts 3D scan data into editable CAD models, enabling precise product design and manufacturing workflows.
Free
Changelog Generator
GitHub Changelog Generator is a free, open-source Ruby-based CLI tool that automates the creation of changelogs by extracting data from GitHub issues, pull requests, and commits to streamline release note management.

Free
UnoCSS
UnoCSS is an open-source, utility-first atomic CSS engine that generates CSS on-demand based on the classes used in your code, optimizing performance by minimizing CSS bundle size.

Enterprise
CockroachDB
CockroachDB is a distributed SQL database designed for cloud-native applications that require strong consistency, high availability, and horizontal scalability across multiple regions.
Subscription
VividCortex
VividCortex is a cloud-based database monitoring platform that provides real-time insights into SQL query performance and resource usage to help optimize and troubleshoot relational databases.