

From my experience with VMind, I found it excels at delivering high-performance interactive visualizations through its WebGL-powered components. The library’s open-source nature and comprehensive set of customizable charts make it a practical choice for developers building data-driven web applications. While the documentation is primarily in Chinese, the codebase and examples are accessible for those familiar with JavaScript and TypeScript. VMind is particularly well-suited for web developers and data analysts who need efficient rendering of large datasets. However, it currently lacks native mobile SDKs and extensive English documentation, which might limit adoption outside Chinese-speaking regions.
VMind Intelligent Visualization Component Library for Data Visualization
VMind is an open-source intelligent visualization component library by VisActor that provides high-performance, customizable components for building interactive data visualizations on the web using WebGL technology.
- Best for
- Interactive Data Visualization
- Key capability
- High-Performance Rendering

Do you recommend this tool?
What is 智能可视化基础组件库—VMind?
VMind is an intelligent visualization component library developed by VisActor Technology that provides a set of foundational, customizable, and high-performance components for building interactive data visualizations on the web. It leverages modern web technologies such as WebGL to enable smooth rendering of complex and large-scale datasets, making it suitable for developers and data analysts who require flexible and efficient visualization solutions.
Key features of 智能可视化基础组件库—VMind
VMind offers a comprehensive suite of visualization components including charts, graphs, and interactive elements, all designed for high performance and ease of integration. It supports customization, real-time data updates, and smooth animations, facilitating the creation of rich data-driven interfaces.
High-Performance Rendering
Utilizes WebGL for smooth and efficient rendering of complex visualizations.
Rich Component Library
Includes a variety of customizable charts and visualization elements.
Interactive Capabilities
Supports user interactions like zoom, pan, and tooltip for enhanced data exploration.
Easy Integration
Designed to be easily integrated into modern web development workflows.
Real-Time Data Support
Enables dynamic updates to visualizations as data changes.
Pros and cons of 智能可视化基础组件库—VMind
Pros
- High-performance rendering with WebGL
- Comprehensive and customizable visualization components
- Free and open-source
- Supports real-time data updates
- Easy to integrate into web projects
Cons
- Documentation primarily in Chinese with limited English resources
- Focused mainly on web platform, no native mobile SDKs
Key use cases for 智能可视化基础组件库—VMind
Interactive Data Visualization
Create dynamic and interactive visualizations for complex datasets using VMind's components.
Dashboard Development
Build customizable dashboards with rich visualization components to monitor key metrics.
UI Component Integration
Integrate VMind's visualization components into web applications for enhanced user experience.
Big Data Analysis
Visualize large-scale data efficiently with VMind's optimized rendering capabilities.
How 智能可视化基础组件库—VMind works
- 1
Install VMind Library
Add VMind to your project via npm or CDN to start using its components.
- 2
Configure Visualization Components
Customize components by setting properties and data sources according to your visualization needs.
- 3
Integrate into Web Application
Embed the configured components into your web pages or dashboards.
- 4
Render and Interact
VMind renders the visualizations efficiently, allowing users to interact with data in real-time.
Who is using 智能可视化基础组件库—VMind
Web developers
Data analysts
Dashboard creators
Software engineers
Data scientists
智能可视化基础组件库—VMind pricing
Free
$0
Full access to VMind's open-source visualization components.
Plans and prices are as published by the vendor and can change. Check the official site before you buy. Open the pricing page (opens in a new tab)
Frequently asked questions about 智能可视化基础组件库—VMind
Yes, VMind is an open-source visualization component library available for free.
VMind is primarily designed for JavaScript and TypeScript environments.
Yes, VMind uses WebGL to efficiently render large and complex datasets.
VMind is optimized for web platforms and can be used in responsive designs, but performance depends on device capabilities.
This tool is designed to help users accomplish its core tasks more efficiently. It is typically used by individuals or teams looking to improve productivity and workflow.
Some tools offer a free plan or trial with limited features. Availability can vary, so confirm on the official website.
Yes, it can help with that use case depending on how you configure it and what features are available. You’ll get the best results with clear inputs and a defined goal.
Sign in to review this tool.
Sign In to ReviewNo reviews yet
Be the first to share how this tool worked for you.
Ask about pricing, limits, or how it compares — or answer someone else.
Sign In to AskNo questions yet
Have a question about using or paying for this tool? Be the first to ask.
Featured on TiorAI



Alternative Tools
Explore similar AI tools that might fit your needs
Free
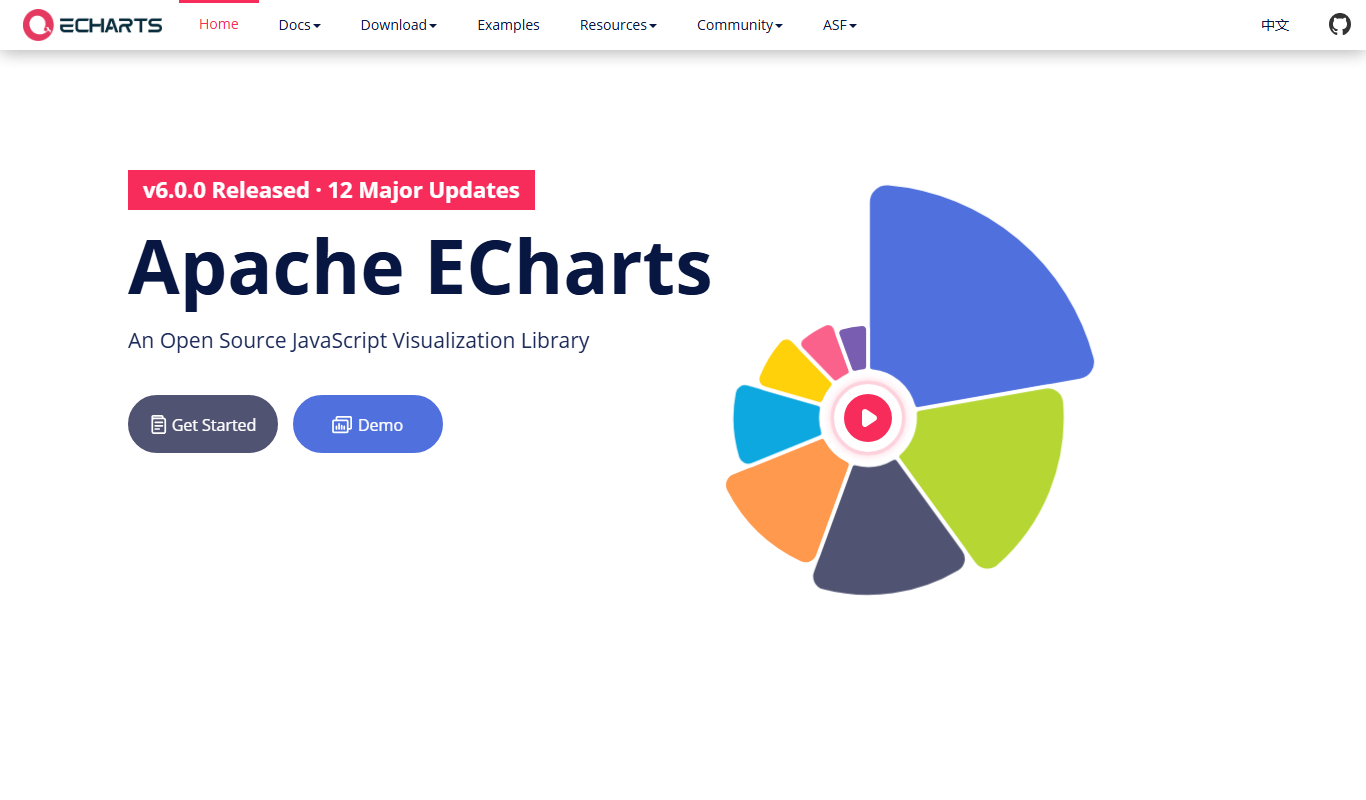
ECharts
ECharts is an open-source JavaScript library by Apache for creating interactive, customizable charts and data visualizations on web and mobile platforms.

Free
D3.js
D3.js is an open-source JavaScript library that enables developers to create dynamic, interactive data visualizations on the web using SVG, HTML, and CSS.
Free
AntV
AntV is an open-source JavaScript data visualization library developed by Alibaba that enables developers to create interactive, customizable charts and graphs for web applications.
More AI Monitor tools
Other tools in the same category, for when this one is not quite the fit.

Custom Pricing
Lava Metrics
Lava Metrics is an AI-driven platform that analyzes customer feedback from multiple sources using sentiment and emotion detection to help businesses improve customer experience.

Free
Knowtify Chat
Knowtify Chat is an AI-powered chatbot platform that automates customer support and lead generation by engaging website visitors with conversational AI.
Freemium
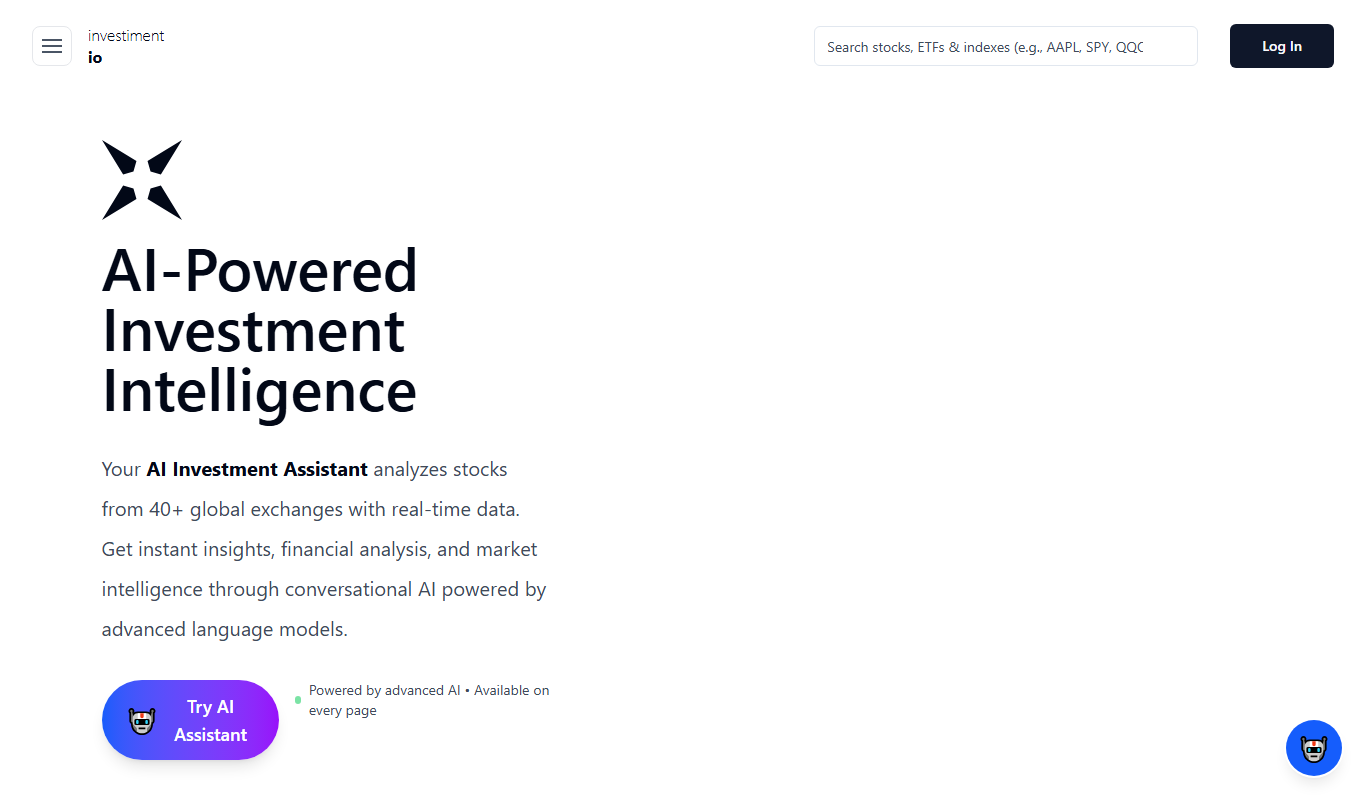
investiment.io
investiment.io is an AI-powered investment platform that helps users manage portfolios, assess risks, and plan finances with actionable insights.

Custom Pricing
sentiance.com
Sentiance is an AI-driven platform that converts smartphone and IoT sensor data into actionable behavioral insights, enabling businesses to understand user context and personalize experiences.

Custom Pricing
vergesense.com
VergeSense is an AI-driven workplace analytics platform that uses IoT sensors to monitor real-time occupancy and space utilization, helping organizations optimize office layouts, ensure safety compliance, and reduce operational costs.

Free
Kuakua – Psychology & AI Tools for Well-Being
Kuakua is an AI-driven platform providing psychology-based exercises and tools to support mental health and well-being through personalized digital experiences.

Freemium
Wheezeless
Wheezeless is an AI-powered tool that detects wheezing sounds in real-time to help asthma patients monitor their respiratory health and receive early alerts for potential attacks.

Free
interviewer.ai
Interviewer.ai is an AI-driven platform that helps job seekers practice interviews by simulating real interview scenarios, generating tailored questions, and providing personalized feedback to improve performance.