

From my experience with TradeUI, I found it excels at providing a highly customizable stock scanning experience combined with real-time alerts that help traders act quickly. The platform’s market dashboard consolidates essential data, making it easier to monitor trends without juggling multiple tools. After spending time with TradeUI, I can say it’s particularly well-suited for active traders and investors who want to streamline their research and decision-making process. However, the lack of a mobile app means you need to access it via web, which might be less convenient on the go. Overall, if you need a powerful, web-based stock scanner with alert capabilities, TradeUI delivers solid results.
TradeUI Stock Market Scanner and Trading Dashboard for Investors
TradeUI is a web-based platform that provides customizable stock scanning, real-time trading alerts, and a market dashboard to help investors identify trading opportunities and manage portfolios efficiently.
- Best for
- Stock Scanning
- Key capability
- Customizable Stock Scanner
Your actions
Save TradeUI, follow its updates and vote on it — everything stays in your account.
Sign in or create a free account

What is TradeUI?
TradeUI is a web-based stock market scanner and trading dashboard designed to help investors and traders identify promising stock opportunities quickly. It provides customizable filters, real-time alerts, and comprehensive market data to streamline the research and decision-making process.
Key features of TradeUI
TradeUI offers advanced stock scanning capabilities, a market overview dashboard, real-time trading alerts, detailed charting tools, and portfolio tracking, all accessible through an intuitive web interface.
Customizable Stock Scanner
Filter stocks using a wide range of technical and fundamental parameters tailored to your strategy.
Real-Time Alerts
Stay updated with instant notifications on stock price changes and trading signals.
Market Overview Dashboard
Visualize market breadth, sector performance, and trending stocks in one place.
Detailed Charting Tools
Access interactive charts with multiple indicators to analyze stock trends.
Portfolio Tracking
Monitor your investments and track performance metrics within the platform.
Pros and cons of TradeUI
Pros
- Comprehensive and customizable stock scanning
- Real-time alerts help timely decision-making
- User-friendly dashboard consolidates market data
- Supports portfolio tracking within the platform
Cons
- No mobile app available, web-only platform
- Pricing may be high for casual investors
Key use cases for TradeUI
Stock Scanning
Identify stocks that meet specific technical and fundamental criteria using customizable filters.
Market Dashboard
Monitor overall market conditions and key stock metrics in a consolidated dashboard.
Trading Alerts
Receive real-time alerts on stock movements and trading signals to act quickly.
Investment Research
Analyze stocks with detailed charts and data to support informed investment decisions.
Portfolio Management
Track and manage your stock portfolio performance within the platform.
How TradeUI works
- 1
Create an Account
Sign up on TradeUI’s website to access the platform.
- 2
Set Your Filters
Customize stock screening criteria based on technical indicators, price, volume, and fundamentals.
- 3
Monitor Market Dashboard
Use the dashboard to get a snapshot of market trends and stock performance.
- 4
Receive Alerts
Get notified in real-time about stocks matching your criteria or significant market movements.
- 5
Analyze and Trade
Review detailed charts and data to make informed trading or investment decisions.
Who is using TradeUI
Active stock traders
Individual investors
Day traders
Investment advisors
Financial analysts
TradeUI pricing
Basic
$19/month
Access to core scanning tools and market dashboard with limited alerts.
Pro
$49/month
Full access to all scanners, unlimited alerts, advanced charting, and portfolio tracking.
Plans and prices are as published by the vendor and can change. Check the official site before you buy. Open the pricing page (opens in a new tab)
Frequently asked questions about TradeUI
Yes, TradeUI offers a free trial period so users can explore the platform before subscribing.
Absolutely, TradeUI allows you to set detailed filters based on various technical and fundamental indicators.
Yes, the platform is designed with an intuitive interface that supports both beginners and experienced traders.
TradeUI provides real-time alerts on stock price movements, technical signals, and market events.
This tool is designed to help users accomplish its core tasks more efficiently. It is typically used by individuals or teams looking to improve productivity and workflow.
Yes, it can help with that use case depending on how you configure it and what features are available. You’ll get the best results with clear inputs and a defined goal.
It depends on your specific needs and how you plan to use the tool. The official website and documentation are the best sources for the latest details.
Sign in to review this tool.
Sign In to ReviewNo reviews yet
Be the first to share how this tool worked for you.
Ask about pricing, limits, or how it compares — or answer someone else.
Sign In to AskNo questions yet
Have a question about using or paying for this tool? Be the first to ask.
Featured on TiorAI



Alternative Tools
Explore similar AI tools that might fit your needs

Free
Finviz
Finviz is a web-based financial visualization and stock screening platform that helps investors filter stocks, visualize market data, track portfolios, and access financial news.
More AI Charting tools
Other tools in the same category, for when this one is not quite the fit.

Free
Gorilla Terminal
Gorilla Terminal is a web platform providing real-time stock market data, customizable stock scanners, and integrated trading capabilities for active traders.

Custom Pricing
Bodh
Bodh is a web-based data annotation platform that supports multi-modal data labeling including images, videos, text, and audio to help teams create accurate datasets for machine learning models.

Free Trial
Analytics Model
Analytics Model is a web-based AI platform that automates data analysis and predictive modeling, enabling users to generate insights and visualizations without coding expertise.
Free
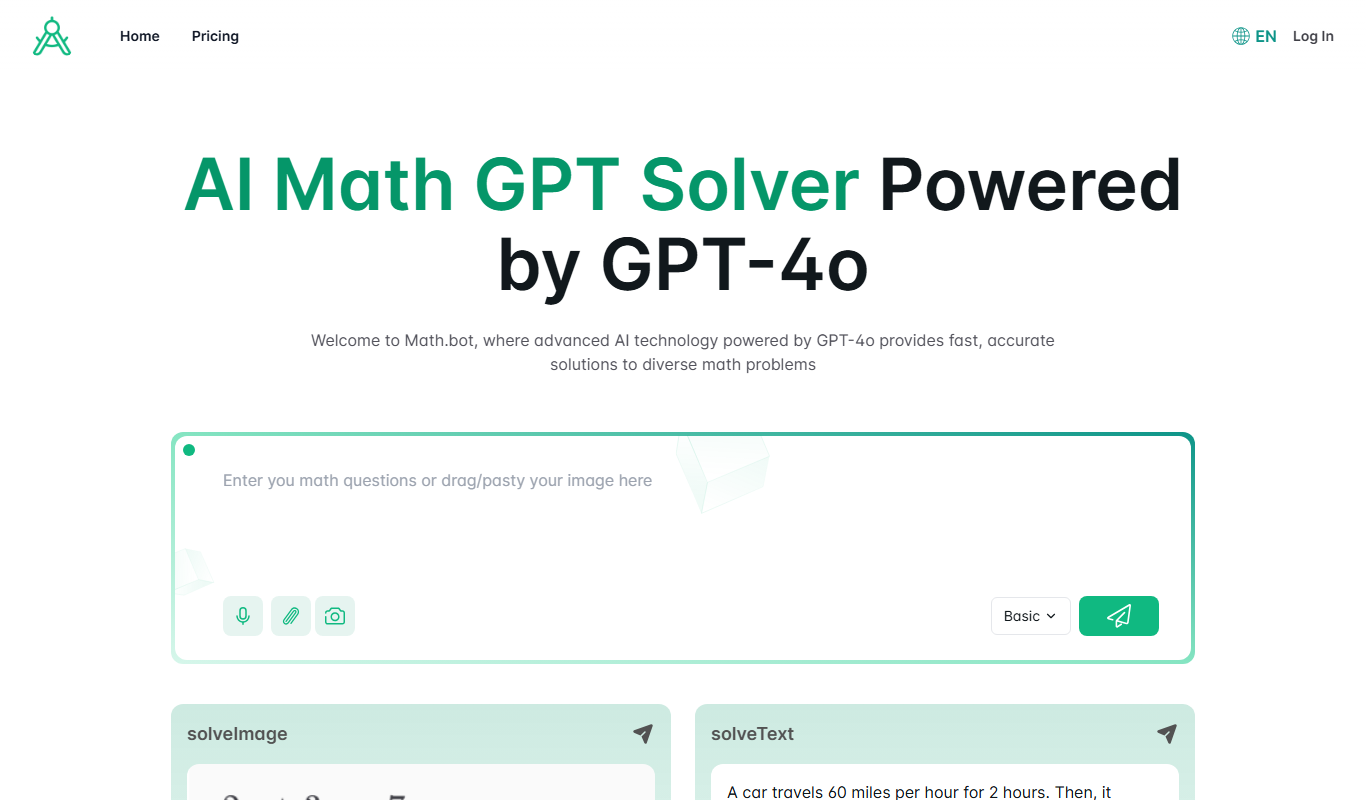
Math.bot: AI Math Solver by GPT-4o
Math.bot is an AI-powered math solver using GPT-4o that provides detailed step-by-step solutions to a wide range of math problems via a web interface.

Freemium
Cloud Hero
Cloud Hero is an AI-driven cloud cost management platform that helps businesses reduce cloud expenses by providing real-time monitoring, multi-cloud visibility, anomaly detection, and budget forecasting.
Free Trial
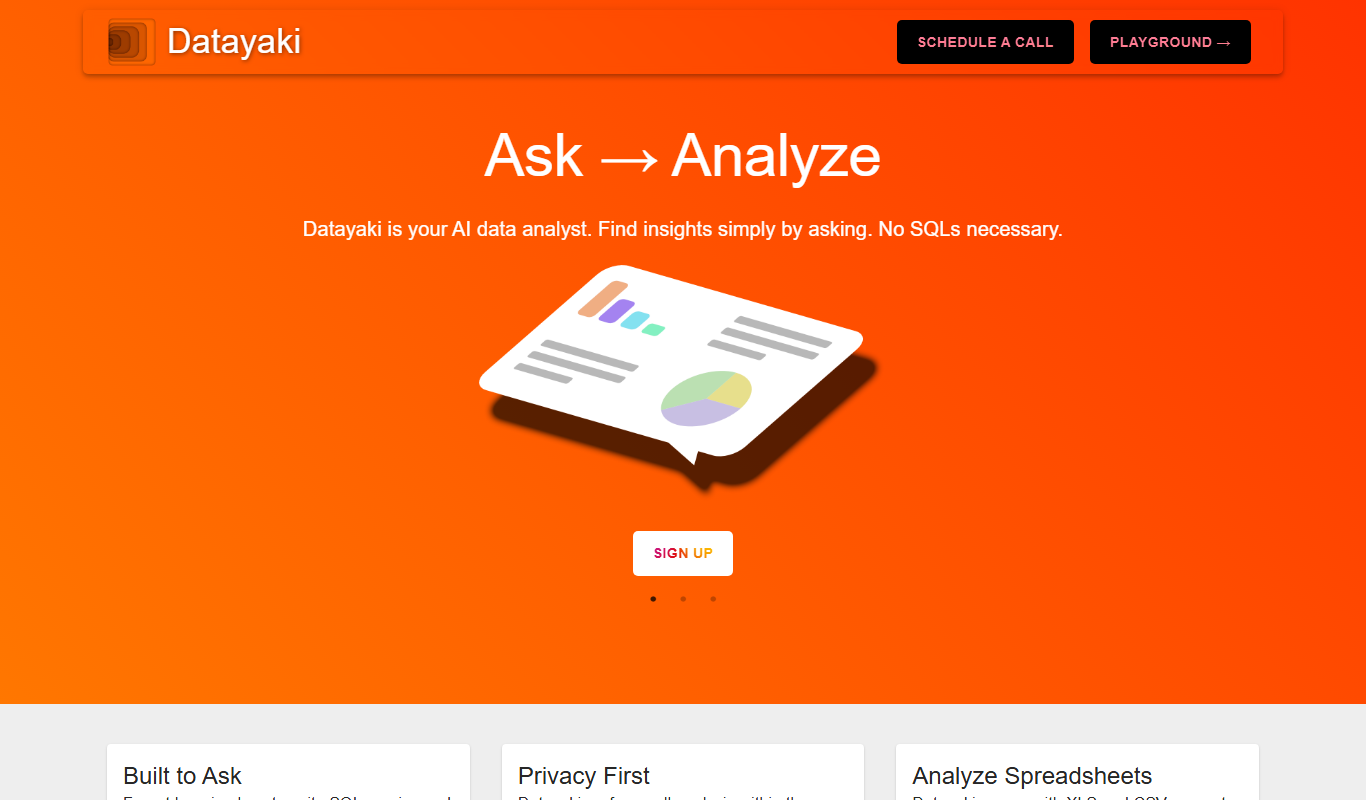
Datayaki
Datayaki is an AI-driven platform that automates data extraction from business documents such as invoices and receipts using OCR and machine learning, offering customizable templates and API integration.

Free Trial
Finalle
Finalle is an AI-powered meeting assistant that automatically transcribes meetings, generates summaries, and extracts action items to help teams save time and improve collaboration.
Free Trial
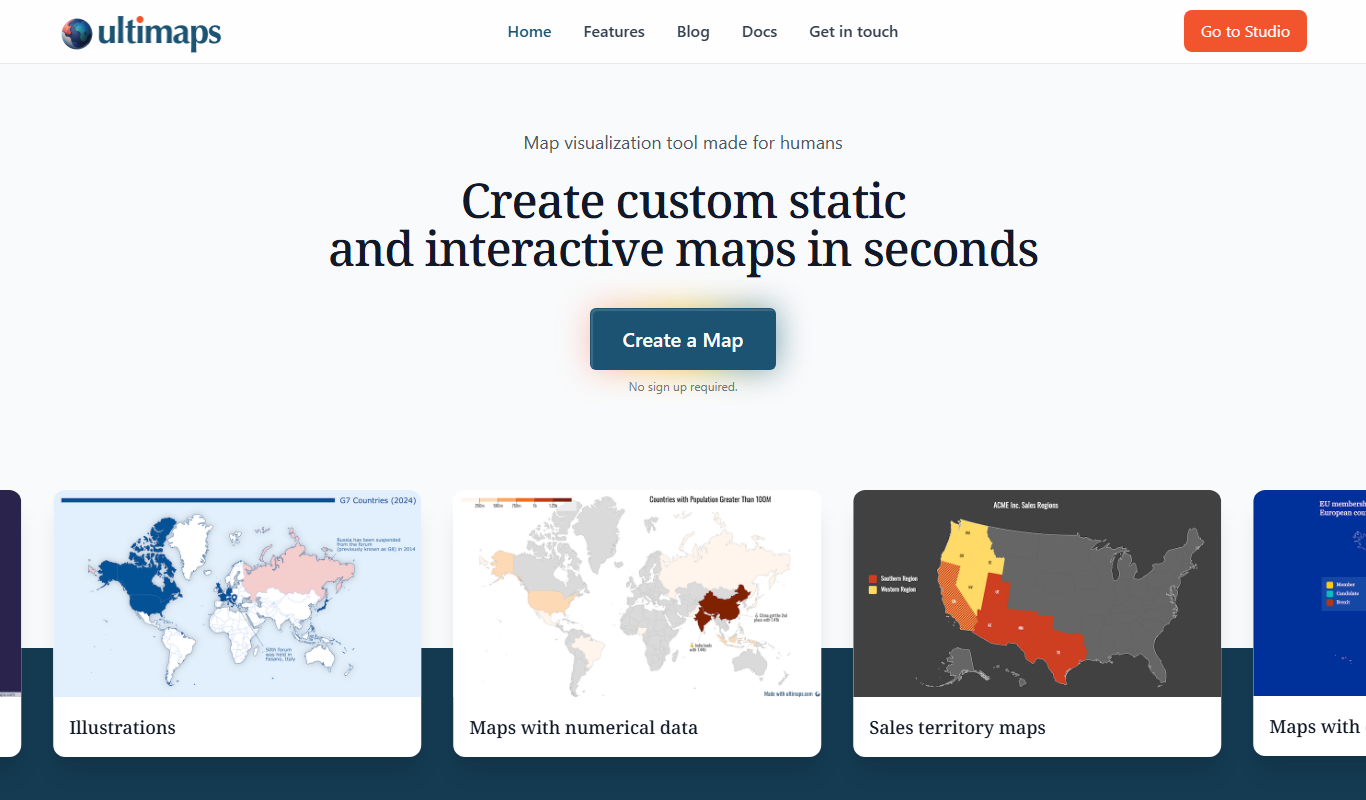
Ultimaps
Ultimaps is an AI-driven platform that helps users create interactive maps and analyze geographic data for better location intelligence and decision-making.