

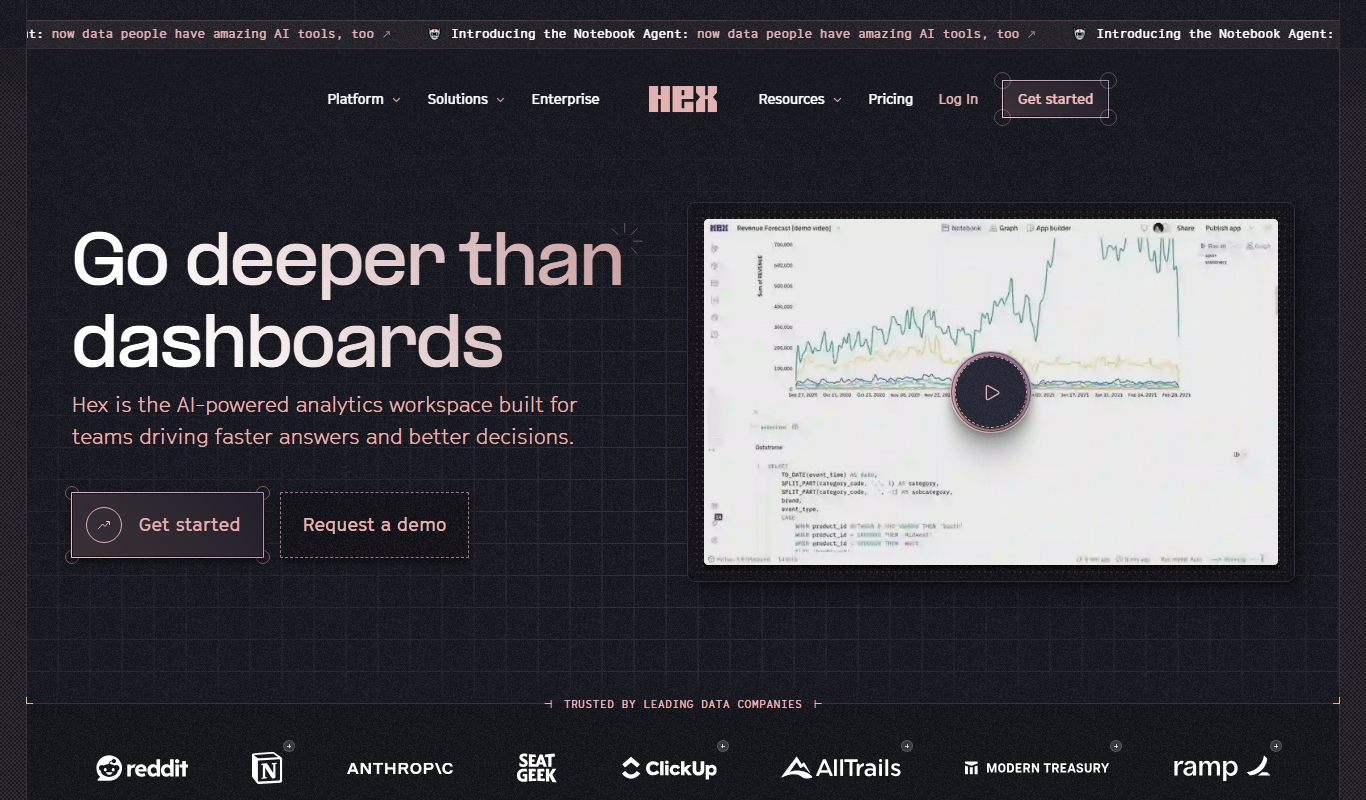
From my experience with Hex, I found it excels at enabling seamless collaboration across data teams by combining code, visualizations, and narrative in a single interactive environment. The support for multiple languages like Python, SQL, and R within one platform makes it versatile for diverse workflows. Hex’s real-time collaboration and integration with major data warehouses make it particularly well-suited for data scientists and analysts working in teams. However, its web-only interface and pricing structure may be limiting for smaller teams or offline use. Overall, Hex is a strong choice if you need a collaborative, code-friendly platform for data exploration and presentation.
Hex Collaborative Data Science Platform for Interactive Notebooks and Dashboards
Hex is a web-based collaborative data science platform that supports Python, SQL, and R for building interactive notebooks and dashboards with real-time team collaboration.
- Best for
- Collaborative Data Analysis
- Key capability
- Multi-Language Support
Do you recommend this tool?
What is Hex?
Hex is a collaborative data science platform that enables teams to create, share, and iterate on interactive notebooks and dashboards. It combines the flexibility of code with the ease of visual data exploration, supporting languages like Python, SQL, and R. Hex is designed to bridge the gap between data engineers, analysts, and business stakeholders by providing a unified environment for data workflows, collaboration, and presentation.
Key features of Hex
Hex offers real-time collaboration on notebooks, interactive visualizations, seamless integration with databases and data warehouses, support for multiple programming languages, and the ability to build shareable dashboards and reports. It emphasizes ease of use for both technical and non-technical users.
Multi-Language Support
Run Python, SQL, and R code seamlessly within the same notebook environment.
Real-Time Collaboration
Multiple users can edit and comment on notebooks simultaneously.
Interactive Visualizations
Create dynamic charts and graphs that update with live data queries.
Data Source Integrations
Connect to popular databases and warehouses like Snowflake, BigQuery, Redshift, and more.
Version Control and History
Track changes and revert to previous notebook versions easily.
Pros and cons of Hex
Pros
- Supports multiple languages in one platform
- Strong real-time collaboration features
- Integrates with major data warehouses
- User-friendly interface for technical and non-technical users
- Robust version control and history tracking
Cons
- Primarily web-based, no desktop app available
- Pricing can be high for small teams at Pro level
- Limited offline capabilities
Key use cases for Hex
Collaborative Data Analysis
Teams can work together in real-time on data notebooks combining code, visualizations, and markdown.
Interactive Dashboards
Create and share interactive dashboards that update dynamically based on live data queries.
Data Exploration and Visualization
Explore datasets visually with built-in charting tools and custom code in Python, SQL, or R.
Reporting and Presentation
Build polished reports and presentations that combine narrative text with live data insights.
Data Engineering and ETL
Use Hex’s integrations and code environment to prepare and transform data pipelines.
How Hex works
- 1
Connect Data Sources
Link Hex to your databases, data warehouses, or APIs to access live data.
- 2
Create Notebooks
Build interactive notebooks using SQL, Python, or R with live code, visualizations, and markdown.
- 3
Collaborate in Real-Time
Work simultaneously with team members, comment, and iterate on data projects.
- 4
Build Dashboards
Assemble interactive dashboards from notebook components to share insights broadly.
- 5
Share and Present
Publish notebooks and dashboards with controlled access for stakeholders and decision-makers.
Who is using Hex
Data scientists
Data analysts
Business intelligence teams
Data engineers
Product managers
Marketing analysts
Hex pricing
Free
$0/month
Basic access with limited projects and collaborators.
Pro
$39/month per user
Advanced features, unlimited projects, and priority support.
Enterprise
Custom pricing
Tailored solutions with enhanced security, compliance, and dedicated support.
Plans and prices are as published by the vendor and can change. Check the official site before you buy. Open the pricing page (opens in a new tab)
Frequently asked questions about Hex
Hex supports Python, SQL, and R within its notebooks.
Yes, Hex integrates with many popular data warehouses such as Snowflake, BigQuery, and Redshift.
Yes, Hex’s visual interface and dashboards make it accessible for business users alongside data teams.
Yes, multiple users can work on notebooks simultaneously with commenting and version control.
This tool is designed to help users accomplish its core tasks more efficiently. It is typically used by individuals or teams looking to improve productivity and workflow.
Yes, it can help with that use case depending on how you configure it and what features are available. You’ll get the best results with clear inputs and a defined goal.
Yes, it can help with that use case depending on how you configure it and what features are available. You’ll get the best results with clear inputs and a defined goal.
Pricing depends on the plan and included features. For the most accurate and up-to-date details, check the official pricing page.
Sign in to review this tool.
Sign In to ReviewNo reviews yet
Be the first to share how this tool worked for you.
Ask about pricing, limits, or how it compares — or answer someone else.
Sign In to AskNo questions yet
Have a question about using or paying for this tool? Be the first to ask.
Featured on TiorAI



Alternative Tools
Explore similar AI tools that might fit your needs
Free
Observable
Observable is a web-based platform that enables users to create interactive JavaScript notebooks focused on data visualization and collaborative data analysis.

Free
Mode Analytics
Mode Analytics is a collaborative business intelligence platform that enables data analysts and teams to query, analyze, and visualize data using SQL, Python, and R, with features for sharing and automating reports.

Enterprise
Databricks
Databricks is a cloud-based unified data analytics platform that enables scalable big data processing, machine learning, and collaborative data science using Apache Spark technology.
More AI Business Intelligence Tools tools
Other tools in the same category, for when this one is not quite the fit.

Contact for pricing
ODESIS
ODESIS is an AI-driven analytics platform that helps businesses transform data into actionable insights through machine learning, visualization, and predictive analytics.

Free Trial
Trenz.ai
Trenz.ai is an AI-driven data analytics platform that helps businesses analyze data, visualize insights, and forecast trends through an easy-to-use interface.

Custom Pricing
Uranus AI
Uranus AI is a web-based AI-powered data analytics platform that provides predictive analytics, real-time data processing, customizable dashboards, and automated reporting to help businesses gain actionable insights from their data.

Free
numerous
Numerous AI is a data automation platform that connects multiple data sources to automate business reporting and analytics with real-time updates and collaboration features.

Freemium
Datatera.ai
Datatera.ai is an AI-powered data analytics platform that helps businesses integrate data, generate predictive insights, and create customizable dashboards for informed decision-making.

Freemium
Graphy for Data Storytelling
Graphy is a web-based platform designed for creating interactive data stories by combining data visualization with narrative elements, enabling users to communicate insights effectively.

Contact for pricing
SolidPoint
SolidPoint is an AI-driven analytics platform that helps organizations leverage machine learning and predictive analytics to make informed, data-driven decisions through customizable dashboards and real-time insights.

Freemium
X76
X76 is an AI-driven data analysis platform that automates data cleaning, visualization, and predictive analytics to generate actionable business insights.