

From my experience with Graph Commons, I found it excels at making complex network data accessible through an intuitive, collaborative interface. The ability to work with others in real time and visually explore relationships helps teams uncover insights that might be missed in spreadsheets. It’s particularly well-suited for researchers, nonprofits, and strategists who need to communicate complex systems clearly. However, the platform is web-only and lacks some advanced analytics features found in specialized software, which could limit power users. Overall, if your goal is collaborative network mapping and storytelling with data, Graph Commons offers a solid, user-friendly solution.
Collaborative Network Mapping and Data Visualization Tool for Research
Graph Commons is a web-based platform that enables users to collaboratively create, visualize, and analyze network maps to understand complex relationships and data patterns.
- Best for
- Collaborative Network Mapping
- Key capability
- Interactive Graph Editor
Your actions
Save Graph Commons, follow its updates and vote on it — everything stays in your account.
Sign in or create a free account
What is Graph Commons?
Graph Commons is a web-based platform designed for collaborative network mapping and data visualization. It enables users to create interactive graphs that represent relationships between entities, facilitating deeper understanding of complex systems. The tool supports teamwork by allowing multiple contributors to build and analyze network maps together, making it valuable for research, strategic planning, and storytelling.
Key features of Graph Commons
Graph Commons offers interactive graph creation, collaborative editing, data import/export, customizable visualization options, and analytical tools to explore network structures and metrics.
Interactive Graph Editor
Drag-and-drop interface for creating and modifying nodes and connections.
Collaborative Workspaces
Multiple users can work simultaneously on the same network map with version control.
Data Import and Export
Supports CSV and JSON formats for importing data and exporting maps.
Network Analytics
Tools to calculate centrality, clusters, and other network metrics.
Customizable Visualizations
Adjust colors, sizes, and layouts to highlight important aspects of the network.
Pros and cons of Graph Commons
Pros
- Intuitive drag-and-drop interface for easy graph creation
- Strong collaboration features for team projects
- Useful analytics tools for network insights
- Flexible data import and export options
- Supports storytelling through visual data narratives
Cons
- Limited advanced analytics compared to specialized network analysis software
- No desktop or mobile app; web-only platform
- Pricing for teams can be expensive for small organizations
Key use cases for Graph Commons
Collaborative Network Mapping
Users can collaboratively create, edit, and analyze complex network maps to visualize relationships and connections.
Data Visualization for Research
Researchers and analysts use Graph Commons to visualize data sets as interactive graphs to uncover patterns and insights.
Social Network Analysis
Organizations map social networks to understand influence, communication flows, and community structures.
Strategic Planning and Decision Making
Businesses and nonprofits utilize network maps to inform strategic decisions and identify key stakeholders.
Storytelling with Data
Users create visual narratives by combining data and network maps to communicate complex information effectively.
How Graph Commons works
- 1
Create an Account
Sign up on the Graph Commons website to start building network maps.
- 2
Build Your Network Map
Add nodes and edges to represent entities and their relationships, customizing visuals as needed.
- 3
Collaborate with Others
Invite team members to contribute, edit, and comment on your network maps in real time.
- 4
Analyze and Visualize
Use built-in analytics to explore network metrics and visualize data patterns interactively.
- 5
Share and Publish
Publish your maps publicly or privately and embed them in websites or presentations.
Who is using Graph Commons
Researchers and academics
Nonprofit organizations
Marketing and communication professionals
Data analysts and strategists
Community organizers
Graph Commons pricing
Free
$0/month
Basic features with limited projects and public maps.
Pro
$15/month
Advanced features including private projects, more collaborators, and priority support.
Team
Custom pricing
Tailored solutions for organizations with multiple users and enhanced collaboration tools.
Plans and prices are as published by the vendor and can change. Check the official site before you buy. Open the pricing page (opens in a new tab)
Frequently asked questions about Graph Commons
Yes, Graph Commons offers a free plan with basic features and public projects.
Yes, the platform supports real-time collaboration with multiple users.
You can import data in CSV and JSON formats to build your network maps.
Private projects are available on paid plans, allowing you to control access.
This tool is designed to help users accomplish its core tasks more efficiently. It is typically used by individuals or teams looking to improve productivity and workflow.
Yes, it can help with that use case depending on how you configure it and what features are available. You’ll get the best results with clear inputs and a defined goal.
Data handling and security practices vary by provider. Review the official privacy policy to understand how your data is stored and used.
Some tools offer a free plan or trial with limited features. Availability can vary, so confirm on the official website.
Sign in to review this tool.
Sign In to ReviewNo reviews yet
Be the first to share how this tool worked for you.
Ask about pricing, limits, or how it compares — or answer someone else.
Sign In to AskNo questions yet
Have a question about using or paying for this tool? Be the first to ask.
Featured on TiorAI



Alternative Tools
Explore similar AI tools that might fit your needs

Free
Kumu
Kumu is a web-based mapping platform that helps users visualize and analyze complex systems and relationships through interactive maps, supporting collaboration and data import.

Free
Gephi
Gephi is a free, open-source software for visualizing and analyzing complex networks and graphs, widely used in research and data science.
More AI Analytics Assistant tools
Other tools in the same category, for when this one is not quite the fit.

Free
Mobalytics
Mobalytics is a gaming analytics platform that provides personalized insights and coaching to help players improve their skills in competitive games, primarily League of Legends.

Free
VidStats
VidStats is a YouTube analytics platform with free and paid tools for tracking channel and video performance.

Freemium
Marcus – your AI Billing Agent
Marcus is an AI-powered billing agent that automates invoice creation, sends payment reminders, and manages accounts receivable to help businesses improve cash flow and reduce manual billing tasks.
Enterprise
Gong.io
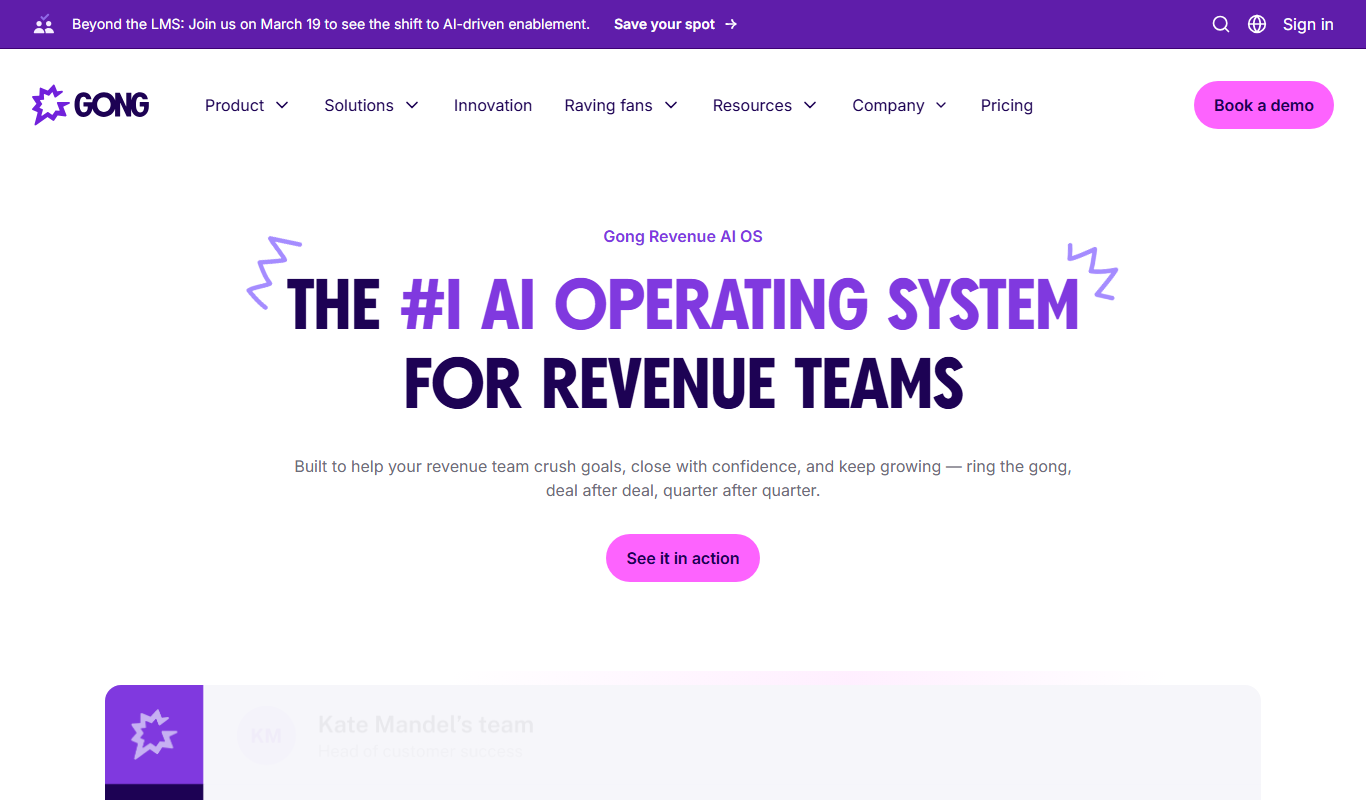
Gong.io is an AI-driven conversation intelligence platform that records, transcribes, and analyzes sales and customer interactions to provide actionable insights for improving sales performance and forecasting.

Freemium
Diffbot
Diffbot is an AI-driven platform that automatically extracts structured data from web pages using machine learning and computer vision, providing APIs for developers to access clean, organized data for various applications.
Free
Zacks Investment Research
Zacks Investment Research provides stock ratings, earnings estimates, and financial research tools to help investors make informed decisions.

Custom Pricing
Avigilon
Avigilon provides integrated video surveillance and AI analytics solutions designed to enhance security monitoring, access control, and incident response for enterprises and organizations.

Enterprise
Rhombus
Rhombus Systems is a cloud-based video security platform that uses AI-powered cameras and analytics to provide businesses with real-time surveillance, alerts, and operational insights accessible remotely.