

Real Estate Investment Analytics Tool for Rental Property Insights and Market Data
Mashvisor is a real estate analytics platform that helps investors find and analyze profitable rental properties using data on rental income, occupancy, and market trends.
- Best for
- Real Estate Investment Analysis
- Key capability
- Comprehensive Property Analytics
Save Mashvisor, follow its updates and vote on it — everything stays in your account.
Sign in or create a free account
What is Mashvisor?
Mashvisor is a real estate analytics platform designed to help investors find and analyze profitable rental properties. It aggregates data from multiple sources to provide insights on property performance, neighborhood trends, and investment potential. The platform uses predictive analytics and machine learning to estimate rental income, occupancy rates, and cash flow, enabling users to make informed investment decisions quickly and efficiently.
Key features of Mashvisor
Mashvisor offers features such as property search filters, neighborhood analytics, rental income estimates, cash flow calculators, and property comparison tools. It provides both traditional and Airbnb rental data, allowing investors to evaluate short-term and long-term rental strategies. The platform also includes heatmaps to visualize market trends and investment hotspots.
Comprehensive Property Analytics
Access detailed data on rental income, occupancy rates, cash flow, and cap rates for investment properties.
Neighborhood Heatmaps
Visualize market trends and investment hotspots with interactive heatmaps.
Rental Strategy Insights
Compare traditional and Airbnb rental performance to optimize investment returns.
Property Comparison Tool
Evaluate multiple properties side-by-side based on key financial metrics.
Lead Generation for Investors and Agents
Identify high-potential properties and generate leads for real estate professionals.
Pros and cons of Mashvisor
Pros
- Comprehensive and accurate real estate data
- User-friendly interface with powerful analytics
- Supports both traditional and Airbnb rental strategies
- Detailed neighborhood and market insights
- Effective property comparison tools
Cons
- Limited to US real estate markets
- No mobile app available
- Pricing may be high for casual investors
Key use cases for Mashvisor
Real Estate Investment Analysis
Analyze potential investment properties with comprehensive data on rental income, occupancy rates, and cash flow projections.
Market Research
Access neighborhood analytics and market trends to identify profitable real estate markets and optimize investment decisions.
Rental Property Evaluation
Evaluate rental properties using predictive analytics to estimate rental income and return on investment.
Property Comparison
Compare multiple properties side-by-side based on key metrics such as price, rental income, and cap rate.
Real Estate Lead Generation
Generate leads for real estate agents and investors by identifying high-potential properties and markets.
How Mashvisor works
- 1
Create an Account
Sign up on Mashvisor’s website to access the platform’s tools and data.
- 2
Search for Properties
Use filters to find properties based on location, price, rental strategy, and other criteria.
- 3
Analyze Property Data
Review detailed analytics including rental income estimates, occupancy rates, and cash flow projections.
- 4
Compare Properties
Use side-by-side comparison tools to evaluate multiple properties and identify the best investment.
- 5
Make Investment Decisions
Leverage insights and reports to decide on purchasing or marketing rental properties.
Who is using Mashvisor
Mashvisor pricing
Lite
$49.99/month billed annually
Analyze individual properties: traditional rental and Airbnb income and ROI analysis based on actual rental comps, investment opportunity scores and short-term regulatory rules for 500+ cities.
Standard
$74.99/month billed annually ($99.99/month when paying every three months)
All Lite features plus discovery of the most profitable properties and markets nationwide, short term and long term rental rate comparison, 20 Excel search exports per month and side-by-side property comparison.
Professional
$99.99/month billed annually ($119.99/month when paying every three months)
All Standard features plus multifamily listings for up to 3 cities (by request), 60 Excel search exports per month with property PDFs, and uploading and analyzing property listings.
Enterprise
Contact us
The raw, granular data that feeds the investor dashboard: custom data outputs, property and market-level granularity, up to 10 years of historical data, and API, data dumps and bulk downloads.
Plans and prices are as published by the vendor and can change. Check the official site before you buy. Open the pricing page (opens in a new tab)
Frequently asked questions about Mashvisor
Mashvisor allows analysis of residential properties including single-family homes, condos, and multi-family units for both traditional and Airbnb rental strategies.
Yes, Mashvisor covers most major and mid-sized US cities with comprehensive real estate data.
Absolutely, Mashvisor provides specific data and analytics for short-term rental properties on Airbnb.
Ongoing use requires a paid subscription: Lite, Standard and Professional are billed quarterly or yearly, and custom enterprise plans are arranged by contacting Mashvisor.
It depends on your specific needs and how you plan to use the tool. The official website and documentation are the best sources for the latest details.
Yes, it can help with that use case depending on how you configure it and what features are available. You’ll get the best results with clear inputs and a defined goal.
Data handling and security practices vary by provider. Review the official privacy policy to understand how your data is stored and used.
Conclusion
Property searches are narrowed with filters for location, price and rental strategy, and each result carries rental income estimates, occupancy rates and cash flow projections. Traditional and Airbnb rental performance can be compared for a property, and up to four properties can be lined up side by side on price, rental income, cash on cash return and cap rate. Heatmaps show which neighborhoods have low or high listing prices, rental income and Airbnb occupancy.
It is built for real estate investors, property managers and Airbnb hosts. Plans move from Lite, which analyzes individual properties, through Standard’s nationwide discovery of profitable markets to Professional’s multifamily listings and larger Excel exports, billed quarterly or yearly. Enterprise buyers can get the raw data behind the dashboard as custom outputs, API access and bulk downloads.
Sources
Sign in to review this tool.
Sign In to ReviewNo reviews yet
Be the first to share how this tool worked for you.
Ask about pricing, limits, or how it compares — or answer someone else.
Sign In to AskNo questions yet
Have a question about using or paying for this tool? Be the first to ask.
Featured on TiorAI


Alternative Tools
Explore similar AI tools that might fit your needs
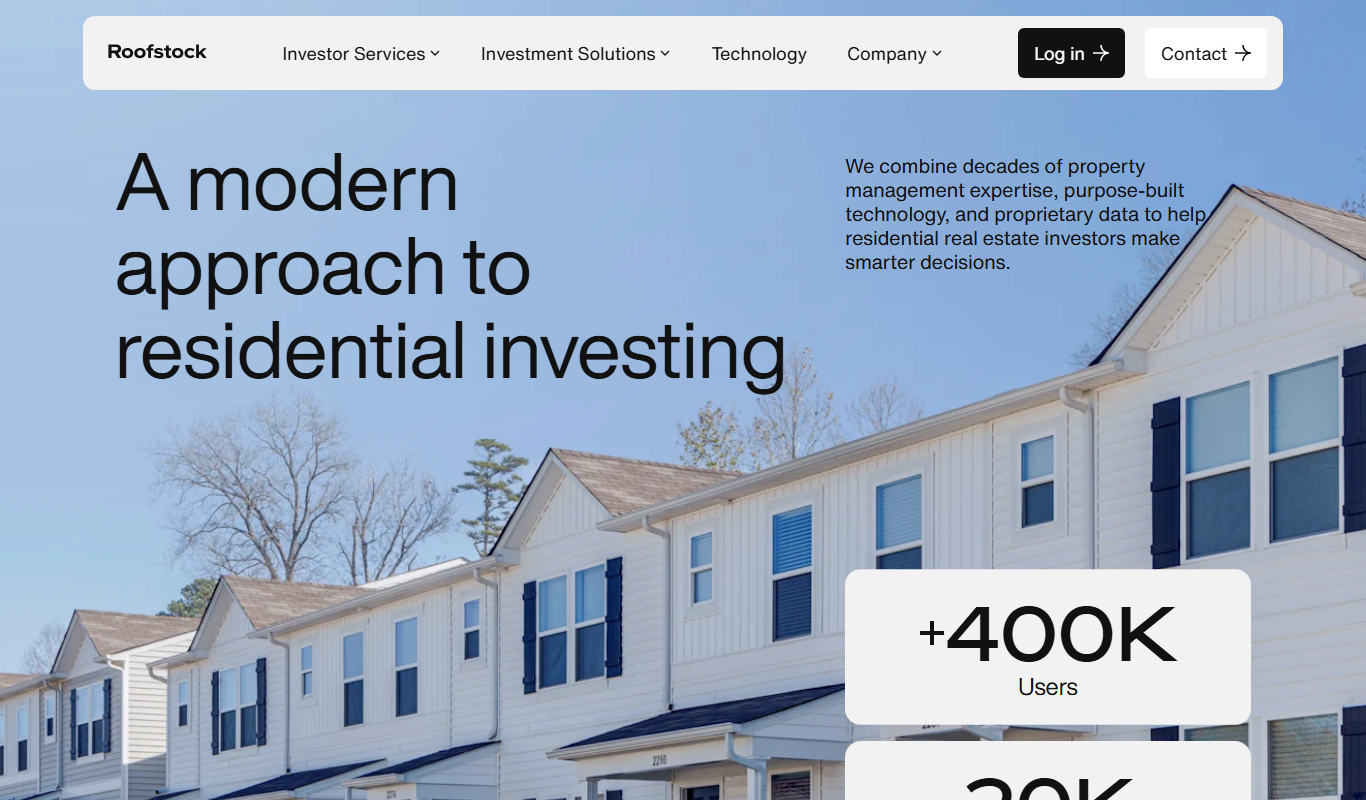
Roofstock
Roofstock is an online platform that allows investors to buy and sell single-family rental properties remotely, offering detailed property data, tenant information, and optional property management services.
More AI Analytics Assistant tools
Other tools in the same category, for when this one is not quite the fit.

ChartPixel
ChartPixel is a web-based platform that turns messy data into interactive charts, written insights and forecasts with AI assisted analysis, and lets users chat with their data.

Jobotrak
Jobotrak is a job application tracker for applications, interviews and contacts, with AI resume tailoring and interview prep and a free plan for up to 20 job applications.

Leverbot
Leverbot is an AI chatbot platform that enables businesses to build no-code conversational bots for customer support and automation.

Inflact
Inflact is an Instagram research and influencer discovery platform to search creators, analyze audience and engagement and track competitor performance.

Veraset
Veraset provides privacy-compliant, high-quality location data via API and web platform to support marketing, retail, and urban planning analytics.

Zebra Technologies
Zebra Technologies offers enterprise-grade hardware and software solutions for barcode scanning, RFID, mobile computing, and real-time asset tracking to optimize industrial and supply chain operations.

Cambridge Mobile Telematics
Cambridge Mobile Telematics provides a mobile telematics platform that uses smartphone sensors and AI to analyze driver behavior, enabling insurers and fleet managers to assess risk, improve safety, and reduce accidents.
Liquidnet
Liquidnet is a global institutional trading platform that connects asset managers and brokers to execute large block equity trades anonymously via a dark pool, providing liquidity and advanced analytics to optimize trade execution.