

Visible.vc Investor Reporting Software for Startup Metrics & Updates
Visible.vc is a web-based platform that enables startups to create, automate, and share investor reports with real-time metrics and customizable dashboards.
- Best for
- Investor Reporting
- Key capability
- Customizable Dashboards
Save Visible.vc, follow its updates and vote on it — everything stays in your account.
Sign in or create a free account
What is Visible.vc?
Visible.vc is a web-based investor reporting platform that helps startups create data-driven updates for their investors. It also provides portfolio monitoring for VC funds and serves 950+ VC funds.
Key features of Visible.vc
Visible.vc offers customizable dashboards, automated data syncing, collaborative report building, and easy sharing options. It integrates with popular data sources and provides templates tailored for fundraising and investor updates.
Customizable Dashboards
Design dashboards that highlight the most important metrics for your investors.
Automated Data Sync
Integrate with spreadsheets and financial tools to keep reports up-to-date without manual entry.
Collaborative Editing
Multiple team members can work together on reports to maintain data integrity.
Investor Sharing Tools
Easily share reports with investors through secure links or scheduled updates.
Templates for Fundraising
Access pre-built templates designed specifically for fundraising and investor communications.
Pros and cons of Visible.vc
Pros
- Simplifies complex investor reporting processes
- Automates data syncing to reduce manual work
- Supports team collaboration for accurate reports
- Provides professional, customizable templates
- Secure and easy investor sharing options
Cons
- Limited to English language support
- No mobile app available, web-only platform
- Pricing may be high for very early-stage startups
Key use cases for Visible.vc
Investor Reporting
Create and share professional, data-driven reports with investors to keep them updated on company progress.
Fundraising Updates
Streamline communication during fundraising rounds by providing clear, real-time metrics and progress reports.
Performance Tracking
Monitor key business metrics and visualize growth trends to make informed strategic decisions.
Team Collaboration
Enable teams to collaborate on report creation and data input to maintain accuracy and consistency.
Data Integration
Connect with various data sources like spreadsheets and financial tools to automate report generation.
How Visible.vc works
- 1
Sign Up
Create an account on Visible.vc’s website to start building your investor reports.
- 2
Connect Data Sources
Link your spreadsheets, financial software, or other data sources to import key metrics automatically.
- 3
Customize Reports
Use templates or build custom dashboards to display relevant metrics and company updates.
- 4
Collaborate with Team
Invite team members to contribute data and insights to ensure accuracy.
- 5
Share with Investors
Publish and share reports securely with investors via links or scheduled emails.
Who is using Visible.vc
Visible.vc pricing
Starter
$0
Monthly updates to 100 investors, KPI dashboards, two pitch decks and two pipelines. Aimed at founders starting a fundraise.
Base
$69/month
Updates to 250 investors from the account's own domain, unlimited pipelines and decks, and one data room.
Core
$149/month
Updates to 500 investors from the company's own domain, per slide analytics and three data rooms with advanced analytics.
Growth
$249/month
Updates to 1000 investors, five data rooms with advanced permissions, five KPI integrations and a dedicated customer support manager.
Plans and prices are as published by the vendor and can change. Check the official site before you buy. Open the pricing page (opens in a new tab)
Frequently asked questions about Visible.vc
Yes, Visible.vc supports integration with Google Sheets and Excel to automate data import.
Yes. Monthly updates can go to 100 investors on Starter, 250 on Base, 500 on Core and 1000 on Growth.
Yes, the platform provides customizable templates designed for fundraising updates.
Yes, Visible.vc supports collaborative editing with role-based permissions.
This tool is designed to help users accomplish its core tasks more efficiently. It is typically used by individuals or teams looking to improve productivity and workflow.
It depends on your specific needs and how you plan to use the tool. The official website and documentation are the best sources for the latest details.
Integration support depends on the tool and its available connectors or API. Check the official documentation or integrations page to confirm what is supported.
It depends on your specific needs and how you plan to use the tool. The official website and documentation are the best sources for the latest details.
Conclusion
Reports draw on linked spreadsheets, financial software or other data sources, so key metrics are imported automatically without manual entry. Metrics and company updates are then laid out with templates built for fundraising and investor communications, or with custom dashboards. Team members can contribute data to the same report, and finished updates reach investors through secure links or scheduled emails.
Startup founders, investor relations teams and fundraising professionals are the core users on the company side. It also provides portfolio monitoring for VC funds, serving more than 950 of them. A free Starter plan is followed by Base at $69, Core at $149 and Growth at $249 per month.
Sources
Sign in to review this tool.
Sign In to ReviewNo reviews yet
Be the first to share how this tool worked for you.
Ask about pricing, limits, or how it compares — or answer someone else.
Sign In to AskNo questions yet
Have a question about using or paying for this tool? Be the first to ask.
Featured on TiorAI



More AI Analytics Assistant tools
Other tools in the same category, for when this one is not quite the fit.

CB Insights
CB Insights is a market intelligence platform that uses AI to analyze data on private companies, investors, and market trends to support strategic business decisions.

Celonis
Celonis is a process mining and execution management platform that helps organizations visualize and optimize their business processes using AI-driven analytics and automation.
CloudHealth
CloudHealth by Broadcom is a cloud management platform that helps enterprises optimize cloud costs, enforce governance policies and manage multi-cloud environments.
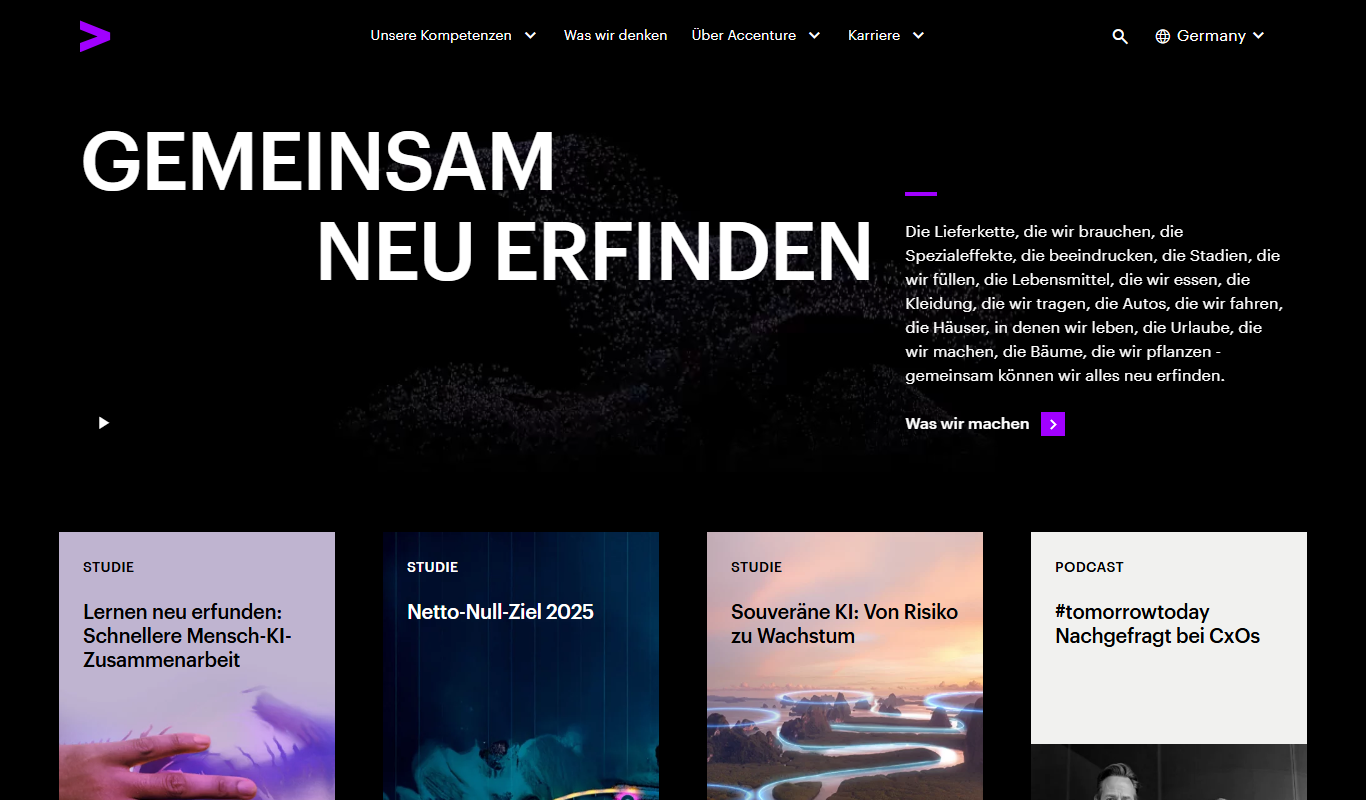
Accenture
Accenture is a global professional services company offering consulting, technology, and digital transformation services to help businesses innovate and improve operations.

Cognizant
Cognizant is a global IT services and consulting company specializing in digital transformation, AI, cloud migration, and custom software development for enterprises.

GosuGamers
GosuGamers is a free esports news and community platform offering real-time tournament coverage, player stats, and forums for competitive gaming fans.

Investing.com
Investing.com is a global financial platform offering real-time market data, news, analysis, and portfolio tracking for stocks, forex, commodities, and cryptocurrencies.

Financial Modeling Prep
Financial Modeling Prep is a financial data API platform providing real-time stock quotes, financial statements, and market data for developers and investors.