

Tsibble R Package for Tidy Temporal Data Frames and Time Series Analysis
Tsibble is an R package that structures temporal data into tidy data frames with explicit time indexes and keys, enabling efficient time series analysis and integration with tidyverse tools.
- Best for
- Time Series Data Management
- Key capability
- Tidy Temporal Data Frames
Save tsibble, follow its updates and vote on it — everything stays in your account.
Sign in or create a free account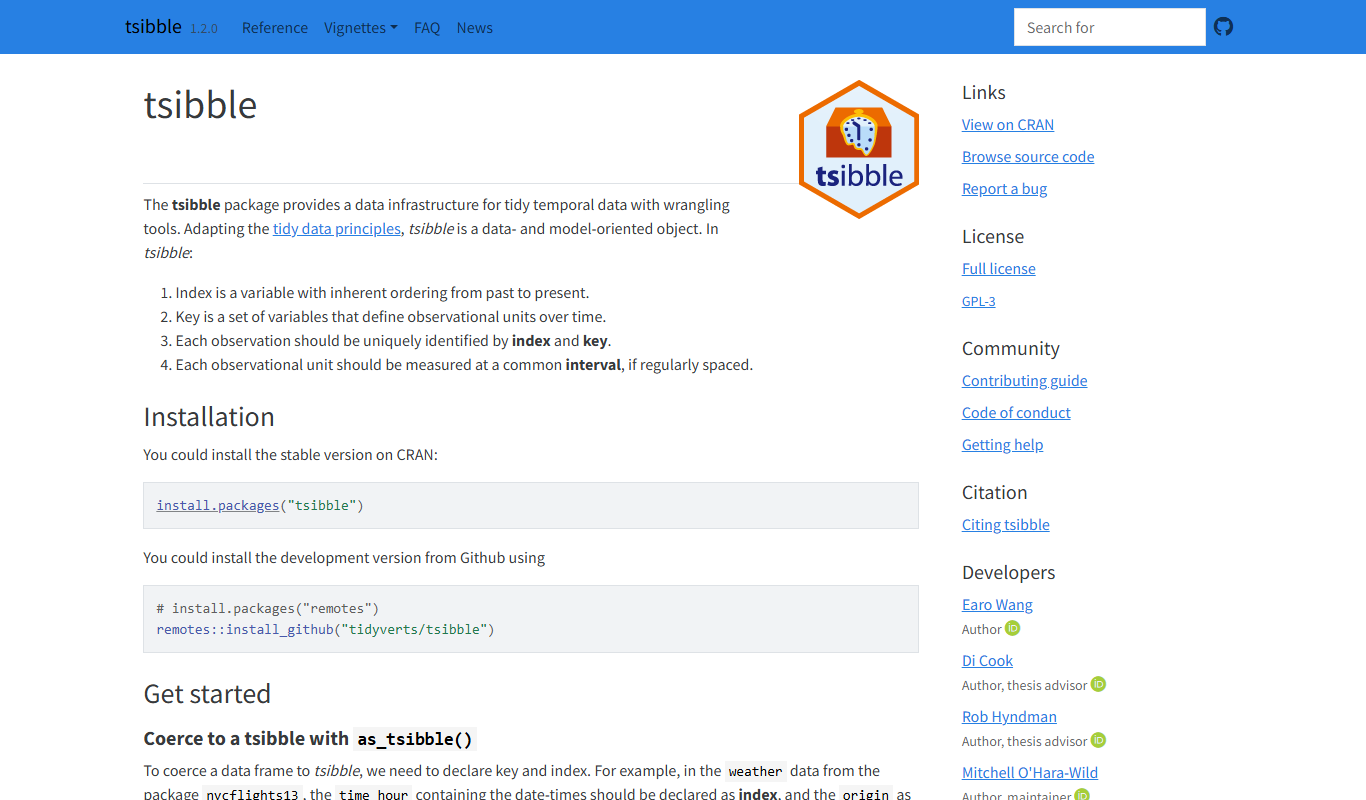
What is tsibble?
Tsibble is an R package designed to provide a tidy data structure for temporal data, specifically time series. It extends the tidyverse principles to time series data, enabling users to work with temporal data frames that have explicit time indexes and keys. This structure facilitates easier manipulation, visualization, and modeling of time series data within the R programming environment.
Key features of tsibble
Tsibble offers a specialized data frame for time series with explicit time indexes, supports gap detection and filling, integrates with tidyverse tools, and provides functions for summarizing and manipulating temporal data efficiently.
Tidy Temporal Data Frames
Data frames with explicit time indexes and keys for clear temporal data representation.
Gap Detection and Filling
Functions to identify missing time points and fill gaps in time series data.
Integration with Tidyverse
Works seamlessly with dplyr, ggplot2, and other tidyverse packages for data manipulation and visualization.
Support for Irregular Time Series
Handles both regular and irregular time series data effectively.
Pros and cons of tsibble
Pros
- Provides a clear and consistent structure for temporal data
- Integrates well with the tidyverse ecosystem
- Open-source and free to use
- Facilitates gap detection and handling in time series
- Supports both regular and irregular time series
Cons
- Requires familiarity with R and tidyverse concepts
- Limited to R environment, no standalone application
- Documentation can be technical for beginners
Key use cases for tsibble
Time Series Data Management
Organize and manipulate temporal data in a tidy data frame format for easier analysis.
Temporal Data Analysis
Perform time-based data operations such as indexing, filtering, and summarizing time series data.
Integration with Tidyverse
Seamlessly integrate with other tidyverse packages like dplyr and ggplot2 for data transformation and visualization.
Forecasting Preparation
Prepare and structure time series data efficiently for forecasting models and statistical analysis.
How tsibble works
- 1
Install and Load Package
Install Tsibble from CRAN or GitHub and load it into your R session.
- 2
Create a Tsibble Object
Convert your temporal dataset into a tsibble by specifying the index (time variable) and key (grouping variables).
- 3
Manipulate and Analyze
Use tsibble functions along with tidyverse tools to filter, summarize, and visualize time series data.
- 4
Prepare for Modeling
Ensure your data is complete and well-structured for forecasting or other time series models.
Who is using tsibble
tsibble pricing
Free
$0
Free package licensed under GPL-3 on CRAN.
Plans and prices are as published by the vendor and can change. Check the official site before you buy. Open the pricing page (opens in a new tab)
Frequently asked questions about tsibble
A tsibble is a tidy temporal data frame that explicitly defines time indexes and keys for time series data.
Yes, Tsibble supports both regular and irregular time series data.
Yes, Tsibble integrates seamlessly with tidyverse packages like dplyr and ggplot2.
You can install Tsibble from CRAN using install.packages(‘tsibble’) or from GitHub for the latest version.
This tool is designed to help users accomplish its core tasks more efficiently. It is typically used by individuals or teams looking to improve productivity and workflow.
It depends on your specific needs and how you plan to use the tool. The official website and documentation are the best sources for the latest details.
Yes, it can help with that use case depending on how you configure it and what features are available. You’ll get the best results with clear inputs and a defined goal.
It depends on your specific needs and how you plan to use the tool. The official website and documentation are the best sources for the latest details.
Conclusion
A tsibble is a tidy temporal data frame that explicitly defines time indexes and keys for time series data. Converting a dataset means specifying its index, the time variable, and its key, the grouping variables. From there, tsibble functions work with tidyverse packages like dplyr and ggplot2 to filter, summarize and visualize the series. Functions for gap detection and filling help ensure the data is complete before forecasting or other time series models.
Both regular and irregular time series are supported. The package is aimed at data scientists working with time series, statisticians and analysts using R, and it requires familiarity with R and tidyverse concepts. It installs from CRAN, currently at version 1.2.0, and is free under the GPL-3 license rather than MIT.
Sources
Sign in to review this tool.
Sign In to ReviewNo reviews yet
Be the first to share how this tool worked for you.
Ask about pricing, limits, or how it compares — or answer someone else.
Sign In to AskNo questions yet
Have a question about using or paying for this tool? Be the first to ask.
Featured on TiorAI



More AI Analytics Assistant tools
Other tools in the same category, for when this one is not quite the fit.

AudioEye
AudioEye is a digital accessibility platform that uses AI and expert remediation to help websites comply with ADA and WCAG standards, improving accessibility and reducing legal risks.

CoinGecko
CoinGecko is a comprehensive cryptocurrency data aggregator providing real-time market data, portfolio tracking, DeFi and NFT analytics, and a developer API.

VeChain
VeChain is a blockchain platform focused on supply chain management and enterprise solutions, integrating IoT devices and smart contracts to provide transparent, secure, and efficient business processes.

Meltwater
Meltwater is a media intelligence platform that provides real-time monitoring and AI-powered analytics of news and social media to help businesses manage brand reputation and marketing strategies.

Experian
Experian is a global credit reporting and data analytics company providing businesses with credit risk assessment, fraud detection, and marketing data solutions.

Addepar
Addepar is a financial technology platform that aggregates and analyzes complex investment portfolios, providing wealth managers and advisors with customizable reporting and client communication tools.

Datumbox
Datumbox is the official name of this machine learning platform, which provides REST APIs for text analysis such as sentiment analysis, topic detection, language detection and spam filtering.

Data Ladder
Data Ladder is a data quality software platform that helps organizations cleanse, match, deduplicate, and enrich data to improve accuracy and analytics.