

From my experience with Statsbot, I found it excels at making complex data accessible through natural language queries, especially within Slack. This ease of use empowers non-technical team members to explore data and get insights without waiting for analysts. After spending time with the platform, I can say it’s particularly well-suited for marketing teams and product managers who need quick, automated reporting and KPI monitoring. However, there is a trade-off: advanced integrations and features may require some technical setup, which could be a hurdle for smaller teams. Overall, if you want to democratize data access and streamline reporting, Statsbot delivers solid results.
Statsbot AI Analytics Assistant for Data Insights and Business Intelligence
Statsbot is an AI analytics assistant that enables users to query data using natural language, automate reporting, and gain real-time business insights through Slack and web interfaces.
- Best for
- Automated Data Reporting
- Key capability
- Natural Language Querying

Do you recommend this tool?
What is Statsbot?
Statsbot is an AI-powered analytics assistant designed to simplify data analysis and reporting for businesses. It integrates with popular data sources and communication platforms like Slack to deliver real-time insights and automated reports using natural language queries. By bridging the gap between raw data and actionable intelligence, Statsbot helps teams make informed decisions faster without requiring deep technical expertise.
Key features of Statsbot
Statsbot offers automated data reporting, natural language querying, multi-source data integration, real-time KPI monitoring, and seamless Slack integration. These features enable users to interact with their data conversationally and receive instant visualizations and insights.
Natural Language Querying
Interact with your data using simple English questions without writing SQL.
Multi-Source Data Integration
Connect various data platforms for unified analytics and reporting.
Slack Integration
Access data insights and reports directly within Slack channels or DMs.
Automated Reporting
Schedule and receive automated reports to stay updated on key metrics.
Customizable Dashboards
Visualize KPIs and metrics with tailored dashboards and charts.
Pros and cons of Statsbot
Pros
- Easy natural language querying for non-technical users
- Seamless Slack integration for team collaboration
- Supports multiple data sources for comprehensive analytics
- Automated reporting saves time
- Customizable dashboards for KPI tracking
Cons
- Limited language support (English only)
- Pricing may be high for small startups
- Some advanced features require technical setup
Key use cases for Statsbot
Automated Data Reporting
Generate automated reports from multiple data sources to keep teams updated without manual effort.
Business Intelligence Insights
Extract actionable insights from complex datasets to support data-driven decision making.
Slack Data Queries
Use natural language queries within Slack to get instant answers and visualizations from your data.
KPI Monitoring
Track key performance indicators in real-time with customizable dashboards and alerts.
Data Integration
Connect various data sources such as databases, Google Analytics, and cloud services for unified analytics.
How Statsbot works
- 1
Connect Data Sources
Link your databases, Google Analytics, or cloud data platforms to Statsbot.
- 2
Integrate with Slack
Add Statsbot to your Slack workspace to enable conversational data queries.
- 3
Ask Questions
Use natural language to ask Statsbot questions about your data directly in Slack or the web app.
- 4
Receive Insights
Get instant answers, charts, and reports generated automatically based on your queries.
- 5
Set Alerts and Reports
Schedule automated reports and alerts to monitor KPIs and business metrics continuously.
Who is using Statsbot
Marketing teams
Business analysts
Product managers
Small to medium businesses
Data-driven enterprises
Statsbot pricing
Free
$0/month
Basic access with limited data sources and queries.
Pro
$49/month
Advanced features including unlimited queries, integrations, and priority support.
Enterprise
Custom pricing
Tailored solutions with dedicated support and custom integrations.
Plans and prices are as published by the vendor and can change. Check the official site before you buy. Open the pricing page (opens in a new tab)
Frequently asked questions about Statsbot
Statsbot supports databases like PostgreSQL, MySQL, Google Analytics, and cloud platforms such as BigQuery.
Yes, Statsbot also offers a web application and API access for querying data.
No, Statsbot uses natural language processing to allow users to query data without SQL or coding.
Statsbot can provide near real-time insights depending on the connected data sources.
Integration support depends on the tool and its available connectors or API. Check the official documentation or integrations page to confirm what is supported.
Data handling and security practices vary by provider. Review the official privacy policy to understand how your data is stored and used.
It depends on your specific needs and how you plan to use the tool. The official website and documentation are the best sources for the latest details.
Pricing depends on the plan and included features. For the most accurate and up-to-date details, check the official pricing page.
Sign in to review this tool.
Sign In to ReviewNo reviews yet
Be the first to share how this tool worked for you.
Ask about pricing, limits, or how it compares — or answer someone else.
Sign In to AskNo questions yet
Have a question about using or paying for this tool? Be the first to ask.
Featured on TiorAI



Alternative Tools
Explore similar AI tools that might fit your needs

Free
Mode Analytics
Mode Analytics is a collaborative business intelligence platform that enables data analysts and teams to query, analyze, and visualize data using SQL, Python, and R, with features for sharing and automating reports.
More AI Analytics Assistant tools
Other tools in the same category, for when this one is not quite the fit.

Custom Pricing
Veraset
Veraset provides privacy-compliant, high-quality location data via API and web platform to support marketing, retail, and urban planning analytics.

Custom Pricing
Cambridge Mobile Telematics
Cambridge Mobile Telematics provides a mobile telematics platform that uses smartphone sensors and AI to analyze driver behavior, enabling insurers and fleet managers to assess risk, improve safety, and reduce accidents.
Free
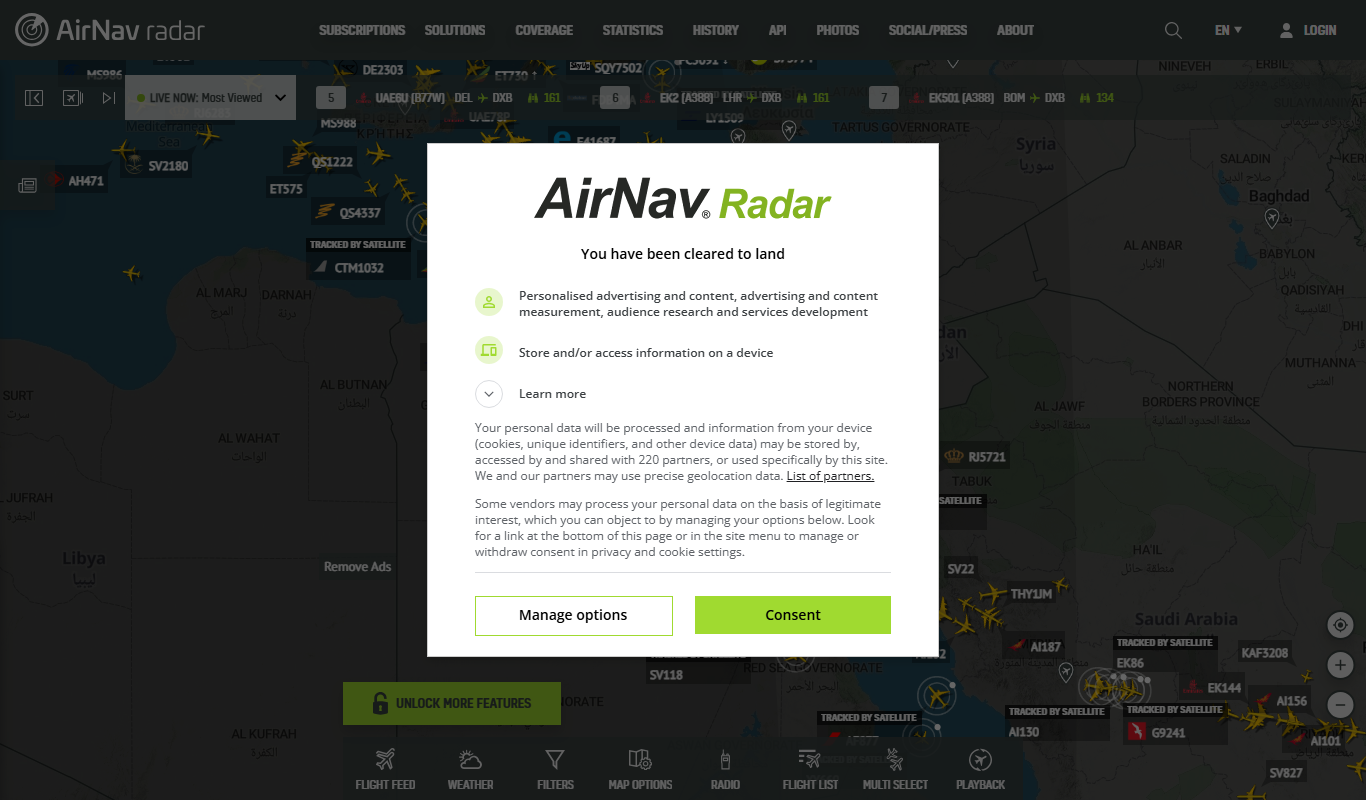
RadarBox
RadarBox is a real-time flight tracking platform offering live aircraft positions, flight history, and aviation data accessible via web and mobile apps.

Free
DeFiChain
DeFiChain is a blockchain platform focused on decentralized finance, enabling fast, secure, and low-cost DeFi applications integrated with Bitcoin.
Custom Pricing
Liquidnet
Liquidnet is a global institutional trading platform that connects asset managers and brokers to execute large block equity trades anonymously via a dark pool, providing liquidity and advanced analytics to optimize trade execution.

Free
Yearn Finance
Yearn Finance is a decentralized finance platform that automates yield farming strategies using smart contracts to maximize returns on Ethereum-based crypto assets.
Free
Stock Rover
Stock Rover is an investment research platform that provides advanced stock screening, portfolio analytics, and comprehensive financial data to help investors analyze and manage their investments effectively.
Free
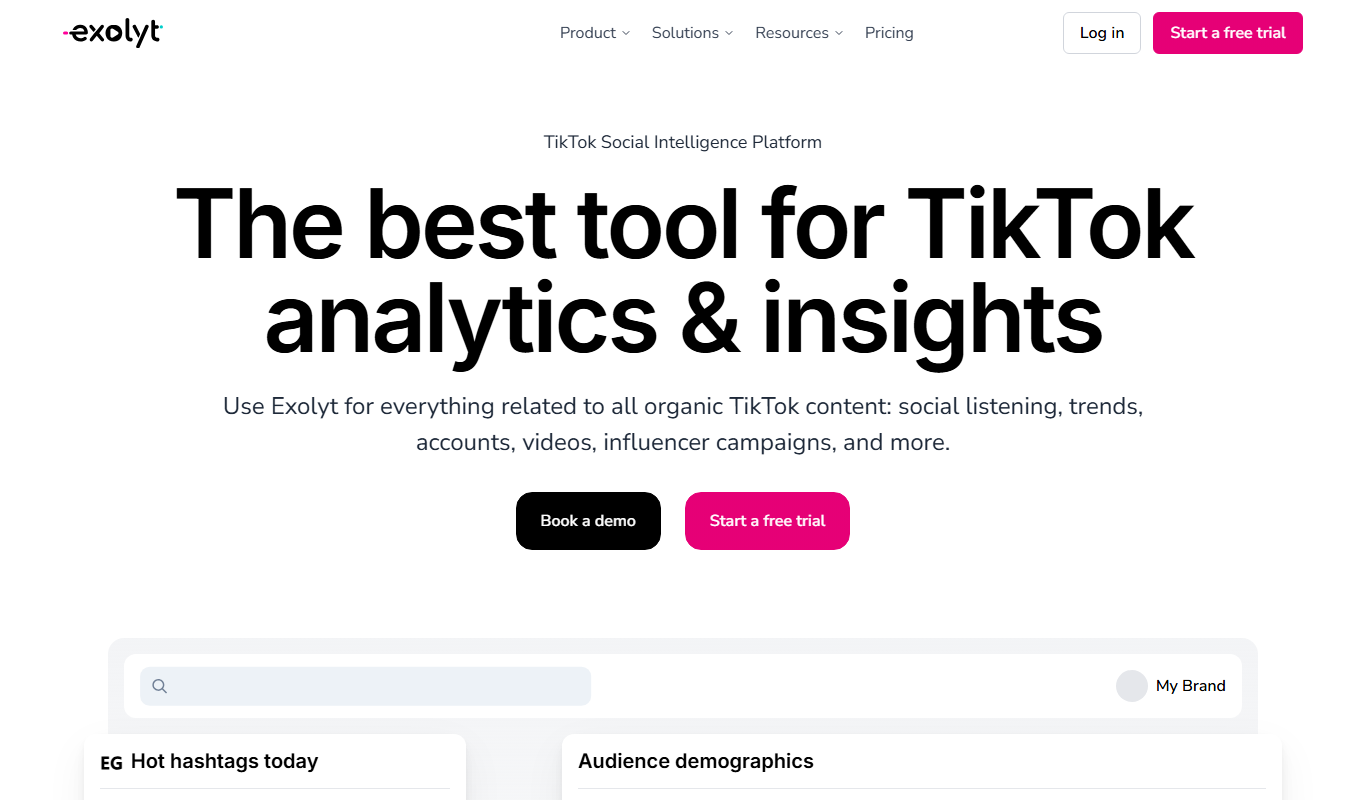
Exolyt
Exolyt is a TikTok analytics tool that helps marketers and influencers track video performance, analyze competitors, and monitor follower growth to optimize TikTok marketing strategies.