

From my experience with IBM SPSS Statistics, I found it excels at providing a comprehensive and user-friendly environment for performing complex statistical analyses and predictive modeling. The software’s intuitive interface combined with powerful automation options makes it accessible to both beginners and advanced users. However, the cost and limited platform support can be a barrier for smaller organizations or those using non-Windows/Mac systems. Overall, if you need reliable, industry-standard tools for data analysis and forecasting, SPSS delivers robust capabilities with strong support.
IBM SPSS Statistics Software for Advanced Data Analysis and Predictive Modeling
IBM SPSS Statistics is a powerful software suite for statistical analysis, data management, and predictive analytics used by researchers and analysts worldwide.
- Best for
- Statistical Data Analysis
- Key capability
- Comprehensive Statistical Tests

Do you recommend this tool?
What is SPSS?
IBM SPSS Statistics is a comprehensive software package designed for statistical analysis, data management, and predictive analytics. It enables researchers, analysts, and business professionals to perform sophisticated data manipulations, statistical tests, and modeling to extract actionable insights from complex datasets. SPSS supports a wide range of statistical procedures and offers an intuitive interface combined with powerful automation capabilities.
Key features of SPSS
SPSS provides a robust suite of features including advanced statistical tests, predictive modeling tools, data visualization options, and automation through scripting. It supports integration with other IBM analytics products and various data sources, making it a versatile tool for data-driven decision making.
Comprehensive Statistical Tests
Includes descriptive statistics, t-tests, ANOVA, correlation, regression, and non-parametric tests.
Predictive Analytics
Supports decision trees, neural networks, and other machine learning algorithms for forecasting.
Data Management
Tools for data cleaning, transformation, and variable creation to prepare datasets for analysis.
Customizable Output
Flexible reporting options with export to PDF, Word, Excel, and integration with visualization tools.
Automation and Scripting
Use Python or SPSS syntax to automate repetitive tasks and extend functionality.
Pros and cons of SPSS
Pros
- Wide range of advanced statistical procedures
- User-friendly interface with point-and-click options
- Strong support for predictive analytics and machine learning
- Extensive documentation and community resources
- Automation capabilities via scripting
Cons
- Pricing can be expensive for small businesses or individual users
- Limited support for Linux or other operating systems
- Steeper learning curve for advanced features
Key use cases for SPSS
Statistical Data Analysis
Perform complex statistical tests and data manipulations to uncover insights from datasets.
Predictive Modeling
Build and validate predictive models using regression, classification, and machine learning algorithms.
Survey Data Management
Analyze survey data with advanced techniques including cross-tabulation, factor analysis, and reliability testing.
Data Visualization
Create detailed charts, graphs, and plots to visualize data trends and statistical results.
Reporting and Automation
Generate automated reports and streamline repetitive analysis tasks with scripting and macros.
How SPSS works
- 1
Install and Launch
Download and install SPSS Statistics on your Windows or MacOS system, then launch the application.
- 2
Import Data
Load datasets from various formats such as Excel, CSV, or databases into SPSS for analysis.
- 3
Select Analysis
Choose from a wide range of statistical tests or modeling techniques based on your research question.
- 4
Run Procedures
Execute the selected analyses and review output including tables, charts, and model summaries.
- 5
Interpret Results
Use SPSS’s visualization and reporting tools to interpret findings and generate reports.
Who is using SPSS
Academic researchers
Market researchers
Data analysts
Business intelligence professionals
Healthcare analysts
SPSS pricing
Subscription
Varies by user and features
Flexible monthly or annual subscription plans tailored for individuals or organizations.
Enterprise Licensing
Custom pricing
Volume licensing options for large organizations with dedicated support and deployment.
Plans and prices are as published by the vendor and can change. Check the official site before you buy. Open the pricing page (opens in a new tab)
Frequently asked questions about SPSS
Yes, SPSS has an intuitive interface and extensive documentation, making it accessible for users new to statistics.
SPSS can process large datasets efficiently, though performance depends on system resources.
Yes, SPSS supports automation through Python scripting and its own syntax language.
SPSS is available for Windows and MacOS operating systems.
This tool is designed to help users accomplish its core tasks more efficiently. It is typically used by individuals or teams looking to improve productivity and workflow.
It depends on your specific needs and how you plan to use the tool. The official website and documentation are the best sources for the latest details.
Yes, it can help with that use case depending on how you configure it and what features are available. You’ll get the best results with clear inputs and a defined goal.
Yes, it can help with that use case depending on how you configure it and what features are available. You’ll get the best results with clear inputs and a defined goal.
Sign in to review this tool.
Sign In to ReviewNo reviews yet
Be the first to share how this tool worked for you.
Ask about pricing, limits, or how it compares — or answer someone else.
Sign In to AskNo questions yet
Have a question about using or paying for this tool? Be the first to ask.
Featured on TiorAI



Alternative Tools
Explore similar AI tools that might fit your needs

Custom Pricing
SAS Analytics
SAS Analytics is a comprehensive platform offering advanced data analytics, AI, and business intelligence tools to help organizations analyze data, build predictive models, and make informed decisions.
More AI Analytics Assistant tools
Other tools in the same category, for when this one is not quite the fit.

Custom Pricing
Veraset
Veraset provides privacy-compliant, high-quality location data via API and web platform to support marketing, retail, and urban planning analytics.

Custom Pricing
Cambridge Mobile Telematics
Cambridge Mobile Telematics provides a mobile telematics platform that uses smartphone sensors and AI to analyze driver behavior, enabling insurers and fleet managers to assess risk, improve safety, and reduce accidents.
Free
RadarBox
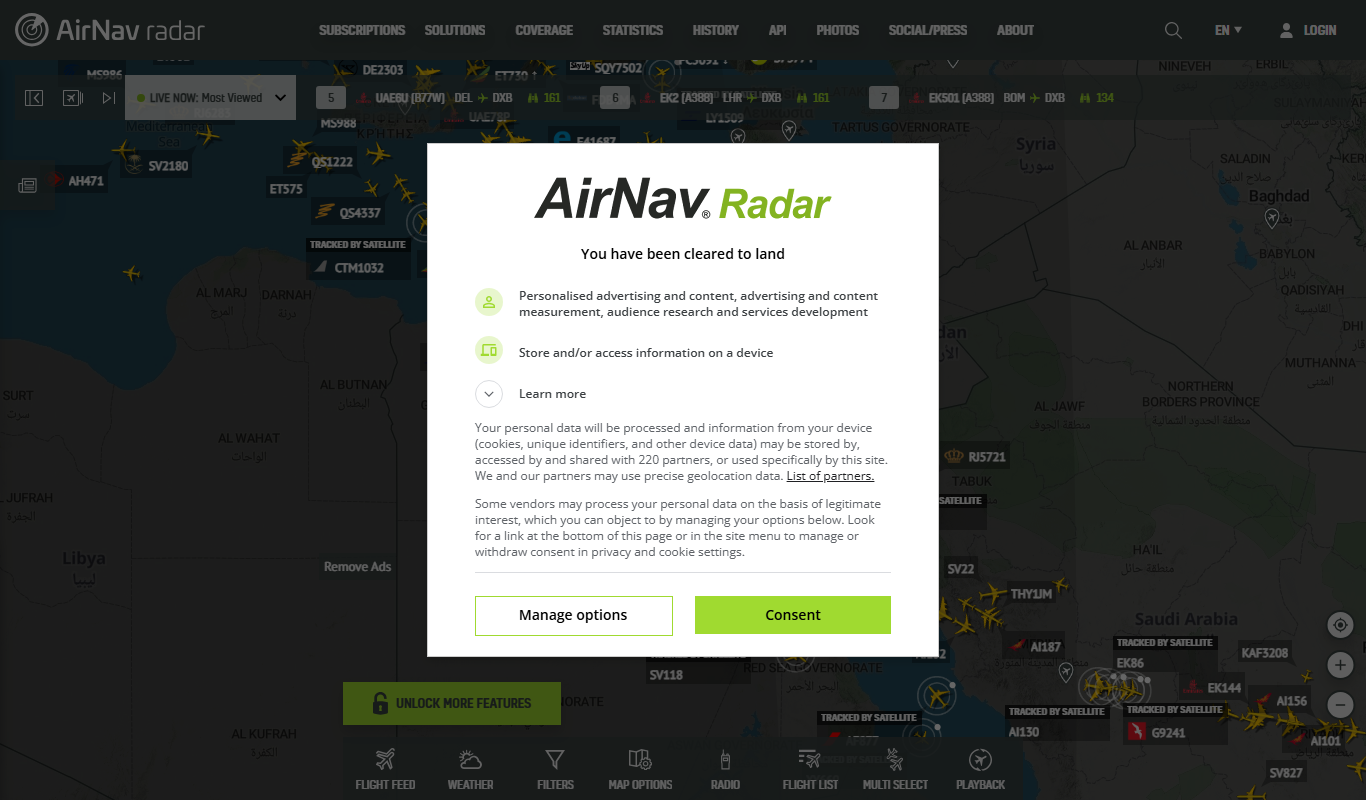
RadarBox is a real-time flight tracking platform offering live aircraft positions, flight history, and aviation data accessible via web and mobile apps.

Free
DeFiChain
DeFiChain is a blockchain platform focused on decentralized finance, enabling fast, secure, and low-cost DeFi applications integrated with Bitcoin.
Custom Pricing
Liquidnet
Liquidnet is a global institutional trading platform that connects asset managers and brokers to execute large block equity trades anonymously via a dark pool, providing liquidity and advanced analytics to optimize trade execution.

Free
Yearn Finance
Yearn Finance is a decentralized finance platform that automates yield farming strategies using smart contracts to maximize returns on Ethereum-based crypto assets.
Free
Stock Rover
Stock Rover is an investment research platform that provides advanced stock screening, portfolio analytics, and comprehensive financial data to help investors analyze and manage their investments effectively.
Free
Exolyt
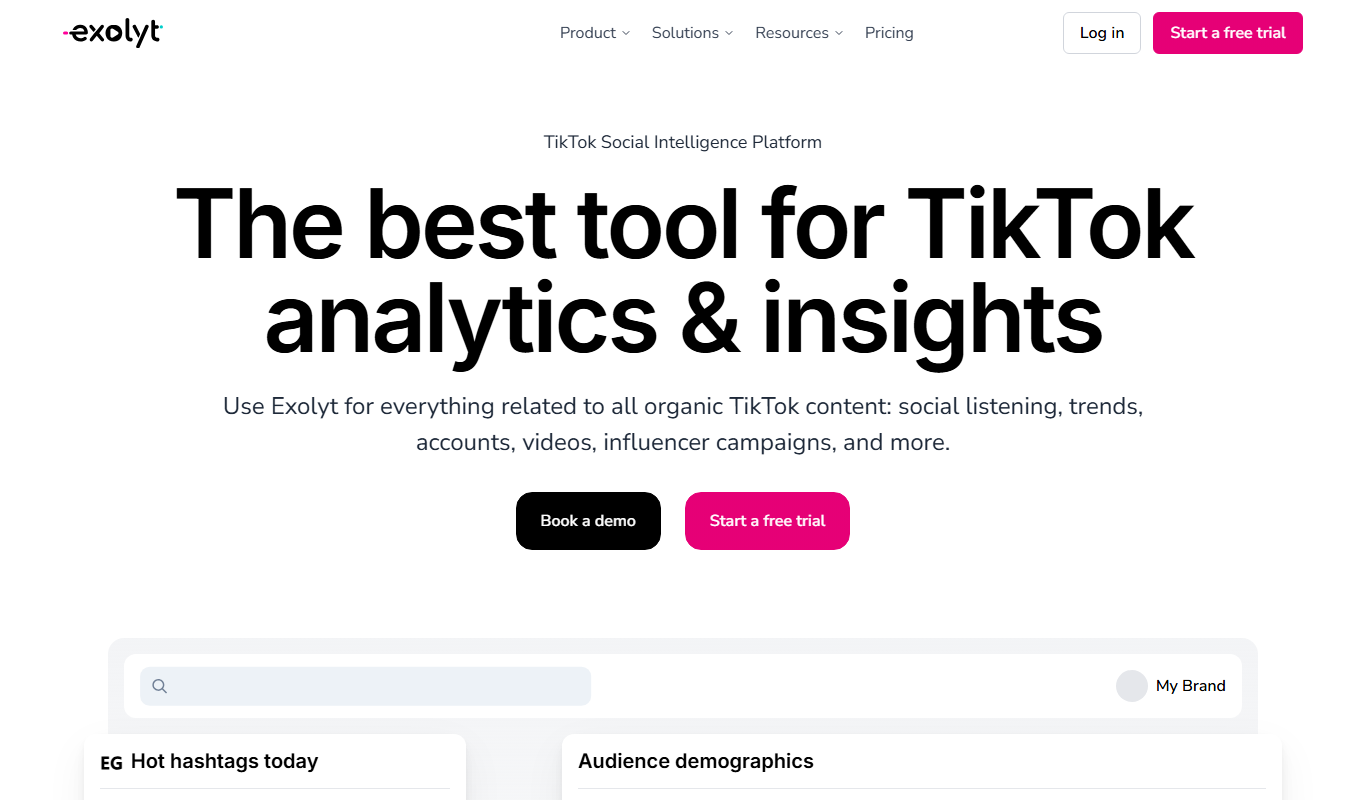
Exolyt is a TikTok analytics tool that helps marketers and influencers track video performance, analyze competitors, and monitor follower growth to optimize TikTok marketing strategies.