
From my experience with ChartX, I found it excels at making data visualization accessible through its AI-powered chart recommendations and intuitive drag-and-drop interface. After spending time with the platform, I can say it’s particularly well-suited for business analysts and teams who need to create interactive dashboards without deep technical skills. However, there is a trade-off: advanced analytics and customization features are mostly reserved for paid plans, and the lack of dedicated mobile apps limits on-the-go access. Overall, if you need a straightforward, AI-assisted tool for building engaging data visualizations on the web, ChartX delivers solid results.

ChartX AI Data Visualization Tool for Interactive Charts and Dashboards
ChartX is an AI-driven data visualization tool that simplifies creating interactive charts and dashboards by recommending optimal visualizations and enabling real-time data integration.
Categories:
AI Business Intelligence Tools
AI Data & Analytics Tools
AI Healthcare & Wellness Tools
Data Visualization
Tech Stack:
JavaScript
Python
React
What is ChartX?
ChartX is an AI-powered data visualization platform designed to simplify the creation of interactive charts and dashboards. It enables users to transform raw data into insightful visual stories without requiring advanced coding skills. The tool leverages artificial intelligence to recommend optimal chart types and layouts based on the data provided, making data analysis accessible to business users and analysts alike.
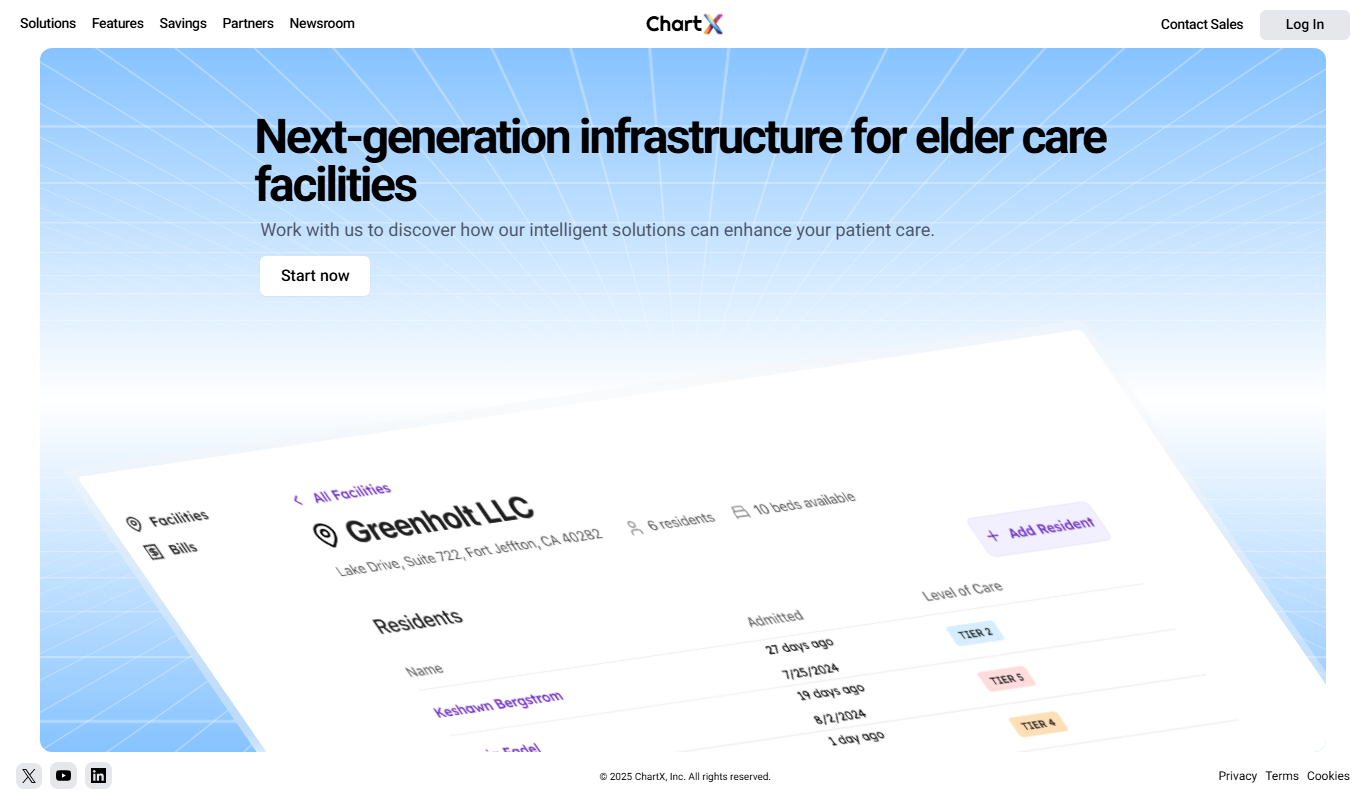
Key Features of ChartX
AI-Powered Chart Recommendations
Automatically suggests the best chart types based on data characteristics to enhance clarity.
Drag-and-Drop Dashboard Builder
Easily create and customize dashboards without coding using an intuitive interface.
Real-Time Data Integration
Supports live data connections for up-to-date visualizations and analytics.
Embedding and Sharing
Embed interactive charts into websites or apps and share dashboards with stakeholders.
Wide Range of Chart Types
Includes bar, line, pie, scatter, heatmaps, and more to suit diverse visualization needs.
Pros and Cons of ChartX
Pros
- User-friendly drag-and-drop interface
- AI-driven chart recommendations simplify visualization choices
- Supports real-time data integration
- Flexible embedding options for websites and apps
- Wide variety of chart types available
Cons
- Limited customization options in the free plan
- Primarily web-based with no dedicated mobile apps yet
- Advanced analytics features require higher-tier plans
Key Use Cases for ChartX
Interactive Data Analysis
Create dynamic and interactive charts to explore datasets visually and gain insights quickly.
Business Reporting
Build customizable dashboards for real-time business reporting and performance tracking.
Data Storytelling
Design compelling visual narratives by combining charts and annotations to communicate data effectively.
Embedded Analytics
Integrate interactive charts and dashboards into web applications or internal tools for enhanced analytics.
How ChartX Works
-
1
Upload or Connect Data
Import datasets via file upload or connect to data sources like databases and APIs.
-
2
AI Chart Suggestions
The AI engine analyzes the data and suggests the most suitable chart types for visualization.
-
3
Customize Visuals
Use drag-and-drop tools to customize charts, add filters, and arrange dashboard components.
-
4
Publish and Share
Publish interactive dashboards and share them via links or embed them into websites and apps.
Who's Using ChartX
Business analysts
Data scientists
Marketing teams
Product managers
Small to medium enterprises
ChartX Pricing
Free
$0/month
Basic features with limited charts and dashboards, suitable for individual users.
Pro
$29/month
Advanced features including unlimited dashboards, real-time data, and priority support.
Enterprise
Custom pricing
Tailored solutions with enhanced security, dedicated support, and custom integrations.
Frequently Asked Questions About ChartX
Yes, ChartX supports connections to various live data sources for real-time updates.
No, ChartX provides a drag-and-drop interface that requires no coding skills.
Yes, ChartX allows embedding interactive charts and dashboards into external websites and applications.
Yes, users can share dashboards and collaborate with team members within the platform.
This tool is designed to help users accomplish its core tasks more efficiently. It is typically used by individuals or teams looking to improve productivity and workflow.
Data handling and security practices vary by provider. Review the official privacy policy to understand how your data is stored and used.
It depends on your specific needs and how you plan to use the tool. The official website and documentation are the best sources for the latest details.
Pricing depends on the plan and included features. For the most accurate and up-to-date details, check the official pricing page.
Share your review
Reviews are limited to one per logged-in user and are published after moderation.
You need an account to review this tool.
0.0
★
★
★
★
★
0 reviews
5 star
0
4 star
0
3 star
0
2 star
0
1 star
0
No reviews yet
Be the first to share how this tool worked for you.
Questions from the community
Read questions and answers about this tool, or ask your own.
No questions yet
Start the conversation by asking the first question about this tool.
Is this tool helpful?

Free Trial
GRID 2.0
GRID 2.0 is an AI-driven data visualization platform that automates dashboard creation and helps businesses analyze data through interactive visual reports.

Enterprise
Flux 1 AI
Flux 1 AI is an AI-driven data analytics platform that enables businesses to perform predictive analytics, visualize data through customizable dashboards, detect anomalies automatically, and generate automated reports to support data-driven decision-making.

Contact for pricing
Thunderbit
Thunderbit is an AI-driven data analytics platform that automates complex data processing, visualization, and predictive analytics to help businesses gain actionable insights without requiring technical expertise.

Freemium
Datatera.ai
Datatera.ai is an AI-powered data analytics platform that helps businesses integrate data, generate predictive insights, and create customizable dashboards for informed decision-making.

Contact for pricing
Tidepool by Aquarium
Tidepool by Aquarium is an AI-driven data analytics platform that helps businesses analyze and visualize data to make informed decisions through customizable dashboards and real-time insights.

Freemium
GrackerAI
GrackerAI is an AI-powered data analytics platform that helps businesses visualize data, track performance, and generate predictive insights through customizable dashboards and automated reports.

Free
Free Market Research Report from Plus AI
Plus AI offers a free AI-powered tool that generates comprehensive market research reports by aggregating data from multiple sources, helping businesses and investors gain insights quickly.

Custom Pricing
Exactly AI
Exactly AI is an AI-driven data analytics platform that helps businesses analyze data, predict trends, and generate actionable insights through customizable dashboards and natural language queries.