
From my experience with Observable, I found it excels at enabling interactive and dynamic data visualizations through its reactive JavaScript notebook environment. The platform’s real-time collaboration and seamless integration with libraries like D3.js make it a powerful tool for data scientists and developers alike. However, it does require some familiarity with JavaScript to unlock its full potential, which might be a learning curve for beginners. Overall, if you need a flexible, web-based environment for prototyping, sharing, and collaborating on data-driven projects, Observable delivers a robust and user-friendly solution.
Observable: Interactive Data Visualization and JavaScript Notebook Platform
Observable is a web-based platform that enables users to create interactive JavaScript notebooks focused on data visualization and collaborative data analysis.
Tech Stack:
D3.js
JavaScript
React
What is Observable?
Observable is a web-based platform that enables users to create, explore, and share interactive JavaScript notebooks focused on data visualization and analysis. It combines live coding with rich visual outputs, allowing data scientists, analysts, and developers to prototype, collaborate, and publish data-driven insights seamlessly.
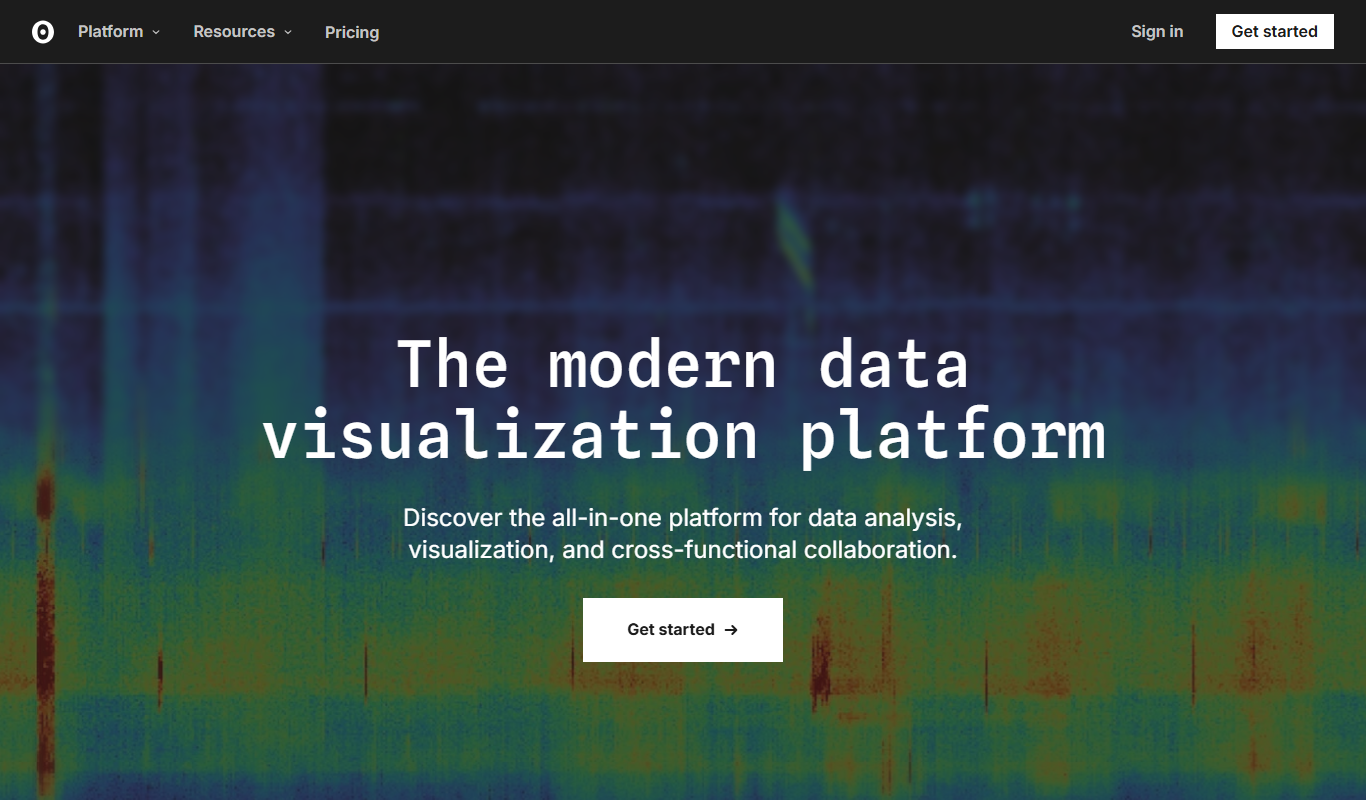
Key Features of Observable
Reactive JavaScript Notebooks
Notebooks automatically update outputs when inputs or code change, enabling dynamic exploration.
Integrated Visualization Libraries
Seamless use of D3.js and other libraries for creating sophisticated visualizations.
Real-Time Collaboration
Multiple users can edit and interact with notebooks simultaneously.
Publishing and Embedding
Easily publish notebooks online or embed visualizations into websites and blogs.
Community and Templates
Access a rich ecosystem of shared notebooks and reusable components.
Pros and Cons of Observable
Pros
- Interactive and reactive notebook environment
- Strong integration with D3.js and visualization libraries
- Real-time collaboration capabilities
- Rich community and reusable components
- Easy publishing and embedding options
Cons
- Requires some JavaScript knowledge for advanced use
- Limited offline capabilities as a web-based platform
- Pricing for private and team features may be costly for some users
Key Use Cases for Observable
Data Visualization
Create interactive and dynamic visualizations to explore and present data insights.
Collaborative Data Analysis
Work with teams in real-time on shared notebooks to analyze and interpret data.
JavaScript Learning and Prototyping
Experiment with JavaScript code snippets and libraries in an interactive environment.
Reporting and Dashboarding
Build live reports and dashboards that update automatically with data changes.
Publishing and Sharing Data Stories
Publish interactive notebooks publicly or privately to share data-driven narratives.
How Observable Works
-
1
Create an Account
Sign up on Observable’s website to start creating notebooks.
-
2
Start a New Notebook
Use the web-based editor to write JavaScript code and build visualizations.
-
3
Leverage Built-in Libraries
Utilize pre-integrated libraries like D3.js for advanced data visualization.
-
4
Collaborate and Share
Invite collaborators or publish notebooks publicly for sharing insights.
Who's Using Observable
Data scientists
Data analysts
JavaScript developers
Researchers
Educators
Observable Pricing
Free
$0/month
Access to public notebooks, basic features, and community resources.
Pro
$12/month
Private notebooks, increased collaboration features, and priority support.
Team
Custom pricing
Advanced collaboration, team management, and enterprise-grade features.
Frequently Asked Questions About Observable
Yes, Observable offers a free plan with access to public notebooks and basic features.
Yes, Observable supports real-time collaboration on notebooks for Pro and Team plans.
Basic JavaScript knowledge helps, but Observable’s reactive environment and community examples make it accessible for learning.
Yes, Observable notebooks and visualizations can be embedded easily into external websites.
This tool is designed to help users accomplish its core tasks more efficiently. It is typically used by individuals or teams looking to improve productivity and workflow.
Some tools offer a free plan or trial with limited features. Availability can vary, so confirm on the official website.
Yes, it can help with that use case depending on how you configure it and what features are available. You’ll get the best results with clear inputs and a defined goal.
It depends on your specific needs and how you plan to use the tool. The official website and documentation are the best sources for the latest details.
Share your review
Reviews are limited to one per logged-in user and are published after moderation.
You need an account to review this tool.
0.0
★
★
★
★
★
0 reviews
5 star
0
4 star
0
3 star
0
2 star
0
1 star
0
No reviews yet
Be the first to share how this tool worked for you.
Questions from the community
Read questions and answers about this tool, or ask your own.
No questions yet
Start the conversation by asking the first question about this tool.
Is this tool helpful?

Free Trial
KaneAI
KaneAI is an AI-driven automated testing platform by LambdaTest that enables cross-browser, mobile, and visual regression testing with cloud infrastructure and CI/CD integration.

Enterprise
Instabug
Instabug is a mobile app bug reporting and user feedback platform that helps developers capture detailed bug reports, crash data, and user feedback directly within their apps to improve app quality and user experience.

Enterprise
OctoML
OctoML is an AI platform that automates the optimization and deployment of machine learning models, improving performance across diverse hardware environments.

Free
Arduino IDE
Arduino IDE is a free, open-source integrated development environment used to write, compile, and upload code to Arduino microcontroller boards, supporting embedded systems development and prototyping.

Freemium
Zyte
Zyte is a web scraping platform that enables businesses and developers to extract structured data from websites using smart crawlers, proxy rotation, and API integration to automate data collection at scale.

Custom Pricing
Clearpath Robotics
Clearpath Robotics provides autonomous mobile robots and software platforms for industrial automation, research, and logistics applications, enabling efficient material transport and robotic development.

Free
CoScreen
CoScreen is a collaborative screen sharing software that enables multiple users to share and interact with individual application windows simultaneously, enhancing remote teamwork and pair programming.

Free
JSON Editor Online
JSON Editor Online is a free web tool that allows users to view, edit, format, validate, and compare JSON data easily without installation or signup.